Note
Go to the end to download the full example code.
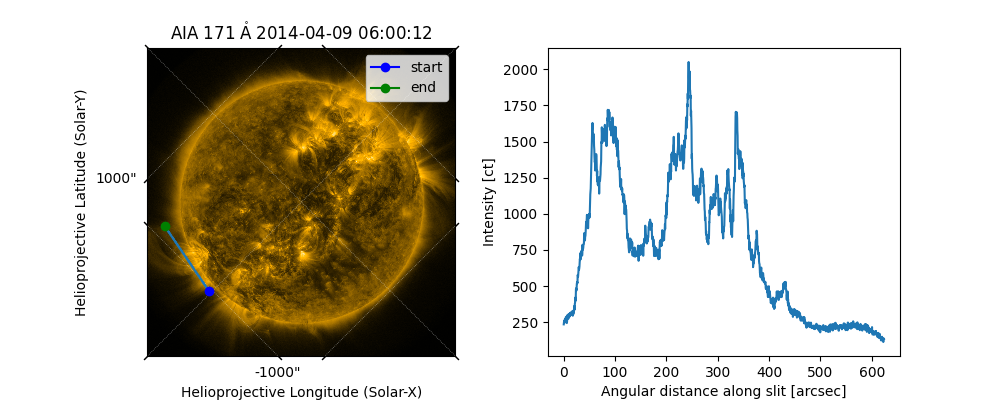
Extracting intensity of a map along a line#
In this example we will extract the intensity values of all the pixels that intersect with a given set of coordinates.
import matplotlib.pyplot as plt

import astropy.units as u
from astropy.coordinates import SkyCoord

import sunpy.map
from sunpy.data.sample import AIA_171_ROLL_IMAGE
First we construct a map, using some sample data.
aia_map = sunpy.map.Map(AIA_171_ROLL_IMAGE)
Next we define a path in a SkyCoord object.
In this example we are just going to use a straight line defined by two points.
However a path with any number of points and any shape can be used.
line_coords = SkyCoord([-1024, -908], [20, 633], unit=(u.arcsec, u.arcsec),
                       frame=aia_map.coordinate_frame)
Next we call the sunpy.map.pixelate_coord_path() function with the map
and the coordinate path to obtain the coordinates of the map pixels that
intersect that path. We pass those coordinates to
sunpy.map.sample_at_coords() to extract the values for those map
pixels.
intensity_coords = sunpy.map.pixelate_coord_path(aia_map, line_coords)
intensity = sunpy.map.sample_at_coords(aia_map, intensity_coords)
Next we will calculate the angular separation between the first point and every other coordinate we extracted. We are doing this to give us a meaningful x-axis for our line plot below.
angular_separation = intensity_coords.separation(intensity_coords[0]).to(u.arcsec)
Finally let’s plot the results.
fig = plt.figure(figsize=(10, 4))
ax1 = fig.add_subplot(121, projection=aia_map)
aia_map.plot(axes=ax1)
ax1.plot_coord(intensity_coords)
ax1.plot_coord(line_coords[0], marker="o", color="blue", label="start")
ax1.plot_coord(line_coords[1], marker="o", color="green", label="end")
ax1.legend()

ax2 = fig.add_subplot(122)
ax2.plot(angular_separation, intensity)
ax2.set_xlabel("Angular distance along slit [arcsec]")
ax2.set_ylabel(f"Intensity [{aia_map.unit}]")

plt.show()
Total running time of the script: (0 minutes 1.302 seconds)