Note
Go to the end to download the full example code.
Finding Local Peaks in Solar Data#
Detecting intensity peaks in solar images can be useful, for example as
a simple flare identification mechanism. This example illustrates detection
of areas where there is a spike in solar intensity.
We use the peak_local_max function in the scikit-image library
to find those regions in the map data where the intensity values form a local maxima.
Then we plot those peaks in the original AIA plot.
import matplotlib.pyplot as plt
from skimage.feature import peak_local_max

import astropy.units as u

import sunpy.map
from sunpy.data.sample import AIA_193_IMAGE
from sunpy.map.maputils import all_pixel_indices_from_map
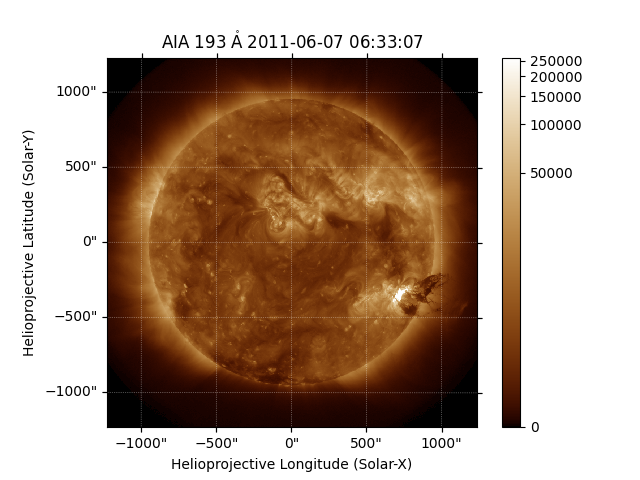
We will first create a Map using some sample data and display it.
aiamap = sunpy.map.Map(AIA_193_IMAGE)
fig = plt.figure()
ax = fig.add_subplot(projection=aiamap)
aiamap.plot(axes=ax)
plt.colorbar()
<matplotlib.colorbar.Colorbar object at 0x744f87b08690>
Before we find regions of local maxima, we need to create some variables to store pixel values for the 2D SDO/AIA data we are using. These variables are used for plotting in 3D later on.
We will only consider peaks within the AIA data that have minimum intensity
value equal to threshold_rel * max(Intensity) which is 20% of the maximum intensity.
The next step is to calculate the pixel locations of local maxima
positions where peaks are separated by at least min_distance = 60 pixels.
This function comes from scikit image and the documentation is found
here peak_local_max.
coordinates = peak_local_max(aiamap.data, min_distance=60, threshold_rel=0.2)
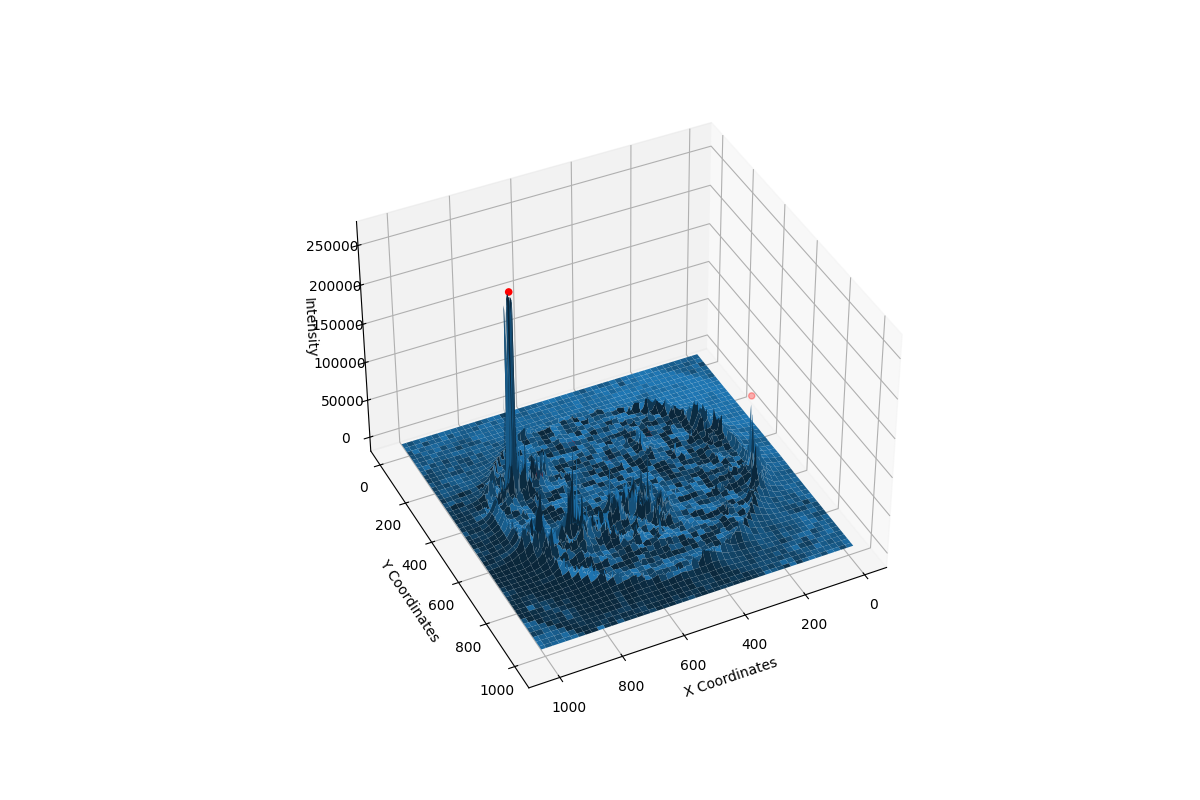
We now check for the indices at which we get such a local maxima and plot those positions marked red in the aiamap data.
fig = plt.figure(figsize=(12, 8))
ax = fig.add_subplot(projection='3d')
ax.plot_surface(X, Y, aiamap.data)
ax.view_init(elev=39, azim=64)
peaks_pos = aiamap.data[coordinates[:, 0], coordinates[:, 1]]
ax.scatter(coordinates[:, 1], coordinates[:, 0], peaks_pos, color='r')
ax.set_xlabel('X Coordinates')
ax.set_ylabel('Y Coordinates')
ax.set_zlabel('Intensity')
plt.show()
Now we need to turn the pixel coordinates into the world location so they can be easily overlaid on the Map.
hpc_max = aiamap.wcs.pixel_to_world(coordinates[:, 1]*u.pixel, coordinates[:, 0]*u.pixel)
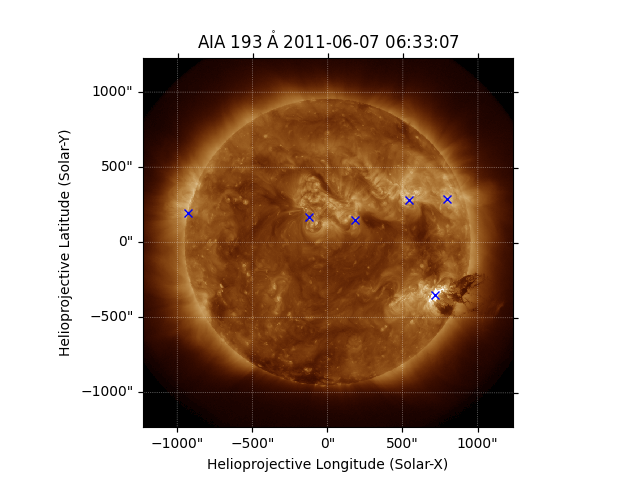
Finally we do an AIA plot to check for the local maxima locations which will be marked with a blue x-label.
fig = plt.figure()
ax = fig.add_subplot(projection=aiamap)
aiamap.plot(axes=ax)
ax.plot_coord(hpc_max, 'bx')

plt.show()
Total running time of the script: (0 minutes 0.704 seconds)