Note
Go to the end to download the full example code.
Plotting the solar equator and prime meridian#
This example shows how you can draw the solar equator and prime meridian (zero Carrington longitude) on Maps as seen by the axes observer.
import matplotlib.pyplot as plt

import astropy.units as u
from astropy.coordinates import SkyCoord

import sunpy.map
from sunpy.data.sample import AIA_171_IMAGE
from sunpy.visualization import drawing
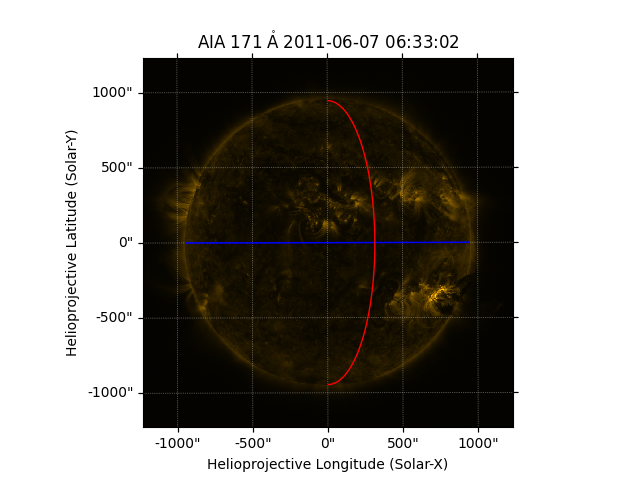
Let’s import sample AIA data and plot it with the equator and prime meridian.
aia_map = sunpy.map.Map(AIA_171_IMAGE)

fig = plt.figure()
ax = fig.add_subplot(projection=aia_map)
aia_map.plot()
drawing.equator(ax, color='blue')
drawing.prime_meridian(ax, color='red')
plt.show()
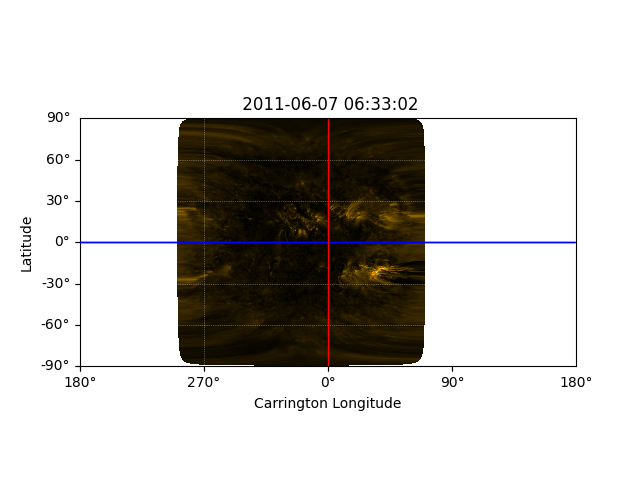
The draw methods also work with heliogaphic maps. To demonstrate this, let’s convert the AIA map to a heliographic Carrington map then plot it with the equator and prime meridian.
frame_out = SkyCoord(0, 0, unit=u.deg,
                     frame="heliographic_carrington",
                     obstime=aia_map.date,
                     observer=aia_map.observer_coordinate,
                     rsun=aia_map.coordinate_frame.rsun)
header = sunpy.map.make_fitswcs_header((720, 1440),
                                       frame_out,
                                       scale=(360 / 1440,
                                              180 / 720) * u.deg / u.pix,
                                       projection_code="CAR")
outmap = aia_map.reproject_to(header)

fig = plt.figure()
ax = fig.add_subplot(projection=outmap)
outmap.plot(axes=ax)
drawing.equator(ax, color='blue')
drawing.prime_meridian(ax, color='red')
plt.show()
Total running time of the script: (0 minutes 1.444 seconds)