Note
Go to the end to download the full example code.
Interactively Selecting Coordinates on a Plot#
In this example we demonstrate how to extract world coordinates of points selected interactively.
Note
We can not demonstrate the interactivity in the documentation. To see this example work correctly please download it and run it locally.
import matplotlib.pyplot as plt
from matplotlib.backend_bases import MouseButton

import astropy.units as u
from astropy.coordinates import SkyCoord

import sunpy.data.sample
import sunpy.map
We will start with using sunpy’s sample data for this example.
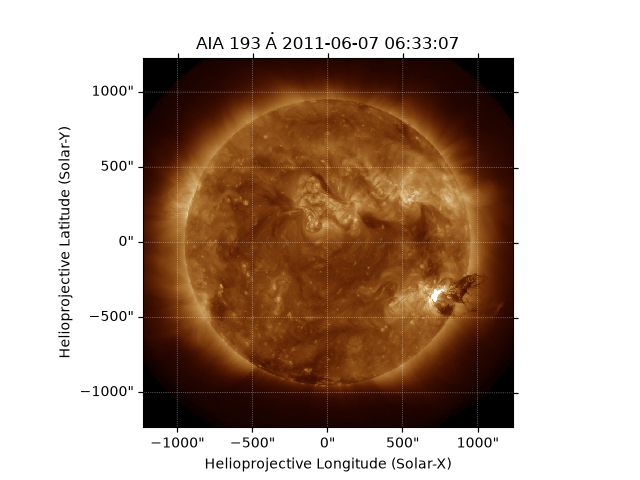
aia_map = sunpy.map.Map(sunpy.data.sample.AIA_193_IMAGE)

fig = plt.figure()
ax = fig.add_subplot(projection=aia_map)
aia_map.plot(axes=ax)
<matplotlib.image.AxesImage object at 0x744fa6e6fd90>
Next we set up a callback function that matplotlib will call each time a button is pressed. We are going to store the clicked positions in world coordinates to make them useful for plotting on other maps or extracting timeseries.
clicked_points = []


def on_click(event):
    # We only want to react to left mouse clicks inside the image
    if event.button is MouseButton.LEFT and event.inaxes:
        # The xdata, ydata point is the pixel coordinates of the displayed map
        point = (event.xdata, event.ydata)

        # We can plot the point
        plt.plot(*point, "o")
        # We have to redraw to update the plot
        plt.draw()

        # Convert the pixel point to world coordinates and store them
        clicked_points.append(aia_map.wcs.pixel_to_world(*point))


# Connect the event to the plot
plt.connect("button_press_event", on_click)
# Display the figure
plt.show()
We are now going to generate an list of points for the documentation. You can remove this code if running locally (or ignore it).
if not clicked_points:
    clicked_points = SkyCoord(
        [-270.75768304, -163.4167166, -78.98673302, 24.88601012, 74.19676398, 108.62529128, 173.31041542],
        [213.16666796, 202.67939786, 205.31559493, 230.42887498, 247.26223829, 298.72639623, 317.47242019],
        unit=u.arcsec,
        frame=aia_map.coordinate_frame,
    )
If points were selected on the plot then we have a list of
SkyCoord objects.
So we stack the list of clicked_points into a single SkyCoord.
clicked_points = SkyCoord(clicked_points)
print(clicked_points)
<SkyCoord (Helioprojective: obstime=2011-06-07T06:33:08.840, rsun=696000.0 km, observer=<HeliographicStonyhurst Coordinate (obstime=2011-06-07T06:33:08.840, rsun=696000.0 km): (lon, lat, radius) in (deg, deg, m)
    (-0.00405795, 0.04788327, 1.51846027e+11)>): (Tx, Ty) in arcsec
    [(-270.75768304, 213.16666796), (-163.4167166 , 202.67939786),
     ( -78.98673302, 205.31559493), (  24.88601012, 230.42887498),
     (  74.19676398, 247.26223829), ( 108.62529128, 298.72639623),
     ( 173.31041542, 317.47242019)]>
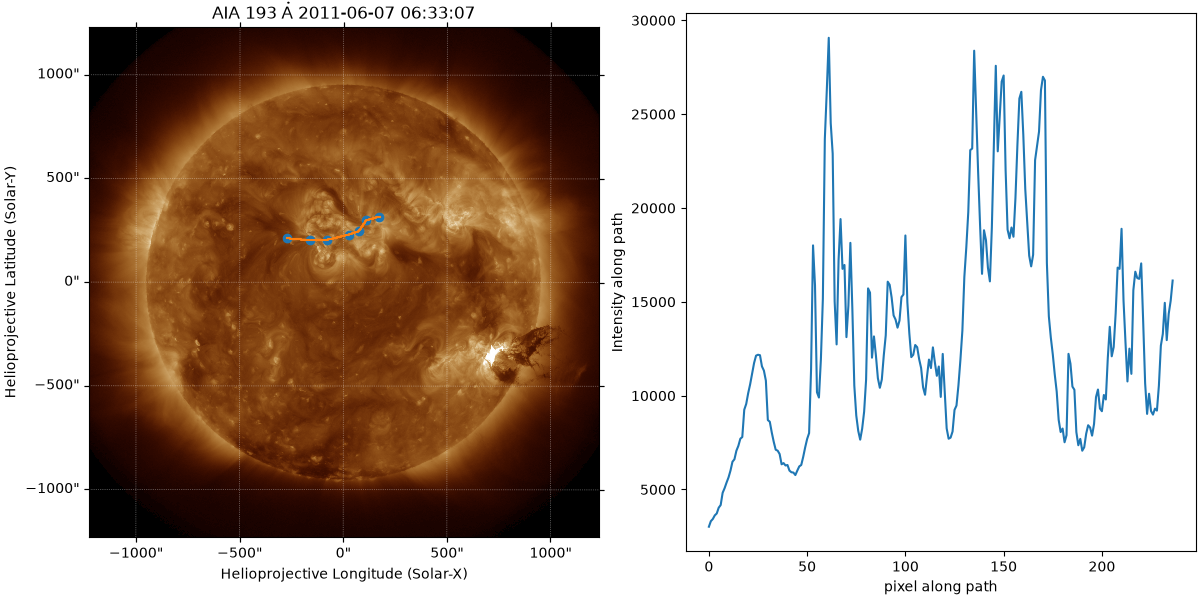
Now pixelate the path and extract the intensities.
pixel_path_coords = sunpy.map.pixelate_coord_path(aia_map, clicked_points)
intensities = sunpy.map.sample_at_coords(aia_map, pixel_path_coords)

fig = plt.figure(layout="constrained", figsize=(12, 6))
ax = fig.add_subplot(121, projection=aia_map)
aia_map.plot(axes=ax)
ax.plot_coord(clicked_points, "o")
ax.plot_coord(pixel_path_coords)

ax = fig.add_subplot(122)
ax.plot(intensities)
ax.set_xlabel("pixel along path")
ax.set_ylabel("Intensity along path")

plt.show()
Total running time of the script: (0 minutes 0.668 seconds)