Note
Go to the end to download the full example code.
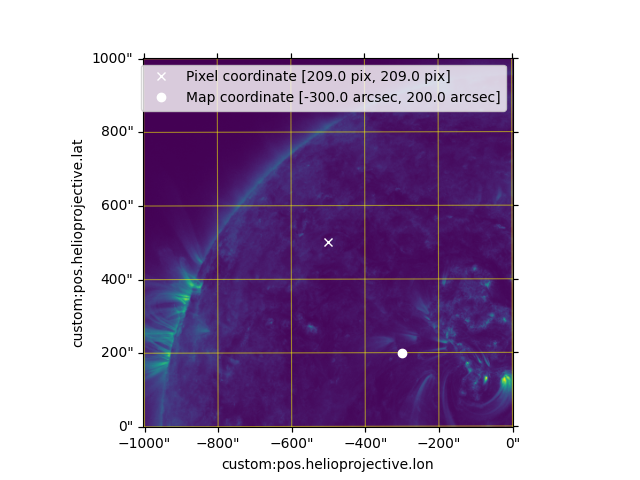
Imshow and maps coordinates#
How to use imshow with a map and overplot points specified by pixel coordinates and map coordinates.
import matplotlib.pyplot as plt

import astropy.units as u
from astropy.coordinates import SkyCoord

import sunpy.map
from sunpy.data.sample import AIA_171_IMAGE
We start with the sample data and create a submap of a smaller region.
aia = sunpy.map.Map(AIA_171_IMAGE)
top_right = SkyCoord(0 * u.arcsec, 1000 * u.arcsec, frame=aia.coordinate_frame)
bottom_left = SkyCoord(-1000 * u.arcsec, 0 * u.arcsec, frame=aia.coordinate_frame)
smap = aia.submap(bottom_left, top_right=top_right)
By setting the projection of the axis, a WCSAxes is created and this enables the plot to be created with the map coordinates, in this case helioprojective coordinates. The standard plot command expects pixel coordinates. It is also possible to plot a point using the map coordinates if we pass the transformation but this transform expects the values to be in degrees and not arcseconds.
fig = plt.figure()
ax = fig.add_subplot(projection=smap)

ax.imshow(smap.data)
<matplotlib.image.AxesImage object at 0x744f87f6e490>
Add an overlay grid, showing the native coordinates of the map.
ax.coords.grid(color='yellow', linestyle='solid', alpha=0.5)
plot a point in the middle of the image
pixel_coord = [smap.data.shape[0]/2., smap.data.shape[1]/2.] * u.pix
ax.plot(pixel_coord[0], pixel_coord[1], 'x', color='white',
        label=f'Pixel coordinate [{pixel_coord[0]}, {pixel_coord[1]}]')
[<matplotlib.lines.Line2D object at 0x744f87f6df90>]
Using the transform command expects coordinates in degrees and not arcseconds.
Total running time of the script: (0 minutes 0.216 seconds)