Note
Go to the end to download the full example code.
Find Peaks in sunpy TimeSeries#
This example illustrates how to find minimum or maximum peaks in a TimeSeries. Note: Peak finding is a complex problem that has many potential solutions and this example is just one method of many.
import matplotlib.pyplot as plt
import numpy as np

from sunpy.data.sample import GOES_XRS_TIMESERIES
from sunpy.timeseries import TimeSeries
We will now create a TimeSeries object from an observational data source, Also, we will truncate it to do analysis on a smaller time duration of 10 years.
goes_lc = TimeSeries(GOES_XRS_TIMESERIES)
my_timeseries = goes_lc.truncate('2011/06/07 06:10', '2011/06/07 09:00')

fig, ax = plt.subplots()
my_timeseries.plot(axes=ax)
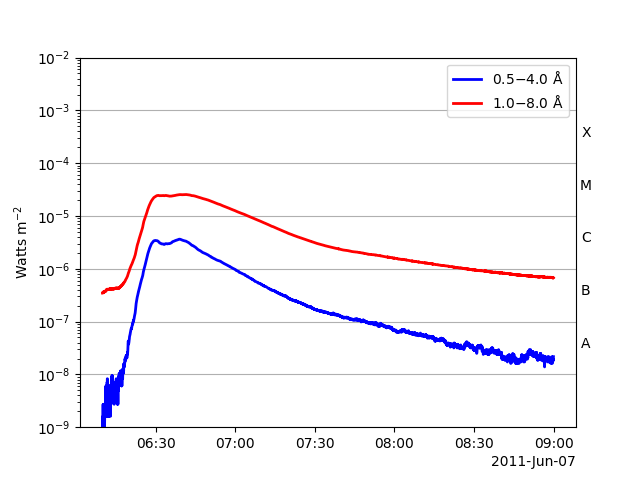
<Axes: ylabel='Watts m$^{-2}$'>
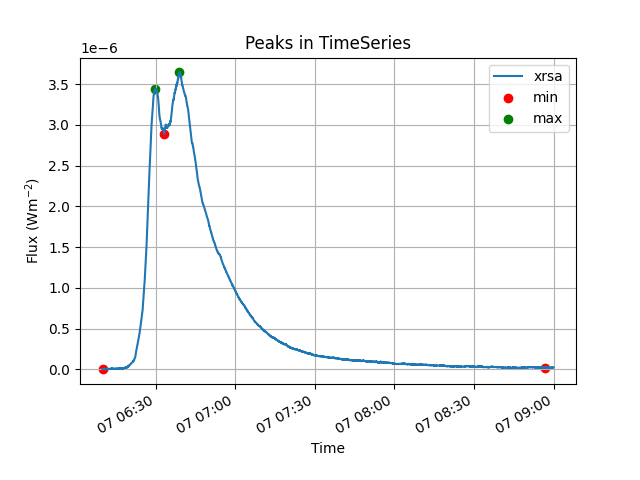
To find extrema in any TimeSeries, we first define a function findpeaks that takes in input an iterable data series and a DELTA value. The DELTA value controls how much difference between values in the TimeSeries defines an extremum point. Inside the function, we iterate over the data values of TimeSeries and consider a point to be a local maxima if it has the maximal value, and was preceded (to the left) by a value lower by DELTA. Similar logic applies to find a local minima.
def findpeaks(series, DELTA):
    """
    Finds extrema in a pandas series data.

    Parameters
    ----------
    series : `pandas.Series`
        The data series from which we need to find extrema.

    DELTA : `float`
        The minimum difference between data values that defines a peak.

    Returns
    -------
    minpeaks, maxpeaks : `list`
        Lists consisting of pos, val pairs for both local minima points and
        local maxima points.
    """
    # Set initial values
    mn, mx = np.inf, -np.inf
    minpeaks = []
    maxpeaks = []
    lookformax = True
    start = True
    # Iterate over items in series
    for time_pos, value in series.items():
        if value > mx:
            mx = value
            mxpos = time_pos
        if value < mn:
            mn = value
            mnpos = time_pos
        if lookformax:
            if value < mx-DELTA:
                # a local maxima
                maxpeaks.append((mxpos, mx))
                mn = value
                mnpos = time_pos
                lookformax = False
            elif start:
                # a local minima at beginning
                minpeaks.append((mnpos, mn))
                mx = value
                mxpos = time_pos
                start = False
        else:
            if value > mn+DELTA:
                # a local minima
                minpeaks.append((mnpos, mn))
                mx = value
                mxpos = time_pos
                lookformax = True
    # check for extrema at end
    if value > mn+DELTA:
        maxpeaks.append((mxpos, mx))
    elif value < mx-DELTA:
        minpeaks.append((mnpos, mn))
    return minpeaks, maxpeaks
Now we take the column ‘sunspot SWO’ of this TimeSeries and try to find it’s extrema using the function findpeaks. We take the value of DELTA to be approximately the length of smallest peak that we wish to detect.
series = my_timeseries.to_dataframe()['xrsa']
minpeaks, maxpeaks = findpeaks(series, DELTA=1e-7)

# Plotting the figure and extremum points
fig, ax = plt.subplots()
ax.set_xlabel('Time')
ax.set_ylabel("Flux (Wm$^{-2}$)")
ax.set_title('Peaks in TimeSeries')
series.plot(ax=ax)
ax.scatter(*zip(*minpeaks), color='red', label='min')
ax.scatter(*zip(*maxpeaks), color='green', label='max')
ax.legend()
ax.grid(True)

plt.show()
Total running time of the script: (0 minutes 0.410 seconds)