Note
Go to the end to download the full example code.
Overlaying differentially rotated gridlines#
How to overlay differentially rotated gridlines on a Map.
The example uses the RotatedSunFrame coordinate
metaframe in sunpy.coordinates to overlay differentially rotated gridlines on
a Map. See Differential rotation using coordinate frames for more details on using
RotatedSunFrame.
import matplotlib.pyplot as plt

import astropy.units as u

import sunpy.map
from sunpy.coordinates import HeliographicStonyhurst, RotatedSunFrame
from sunpy.data.sample import AIA_171_IMAGE
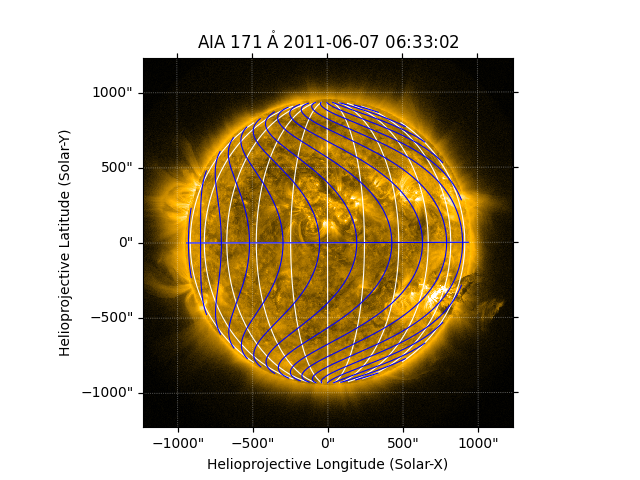
Let’s use an AIA observation, and plot lines of constant longitude in heliographic Stonyhurst. We’ll plot the normal lines (prior to applying differential rotation) in white and the differentially rotated lines in blue.
aiamap = sunpy.map.Map(AIA_171_IMAGE)
fig = plt.figure()
ax = fig.add_subplot(projection=aiamap)
aiamap.plot(axes=ax, clip_interval=(1., 99.95)*u.percent)
<matplotlib.image.AxesImage object at 0x744f8c8f8f50>
Lines of constant longitude prior to differential rotation
overlay1 = ax.get_coords_overlay('heliographic_stonyhurst')
overlay1[0].set_ticks(spacing=15. * u.deg)
overlay1[1].set_ticks(spacing=90. * u.deg)
overlay1.grid(ls='-', color='white')
Differentially rotating the lines of constant longitude by 27 days Be aware that the differentially rotated lines are plotted in the original coordinate frame, so it doesn’t account for any motion of the observer over 27 days.
rs_hgs = RotatedSunFrame(base=HeliographicStonyhurst(obstime=aiamap.date),
                         duration=27*u.day)
overlay2 = ax.get_coords_overlay(rs_hgs)
overlay2[0].set_ticks(spacing=15. * u.deg)
overlay2[1].set_ticks(spacing=90. * u.deg)
overlay2.grid(ls='-', color='blue')

plt.show()
Total running time of the script: (0 minutes 0.760 seconds)