
Note
Go to the end to download the full example code.
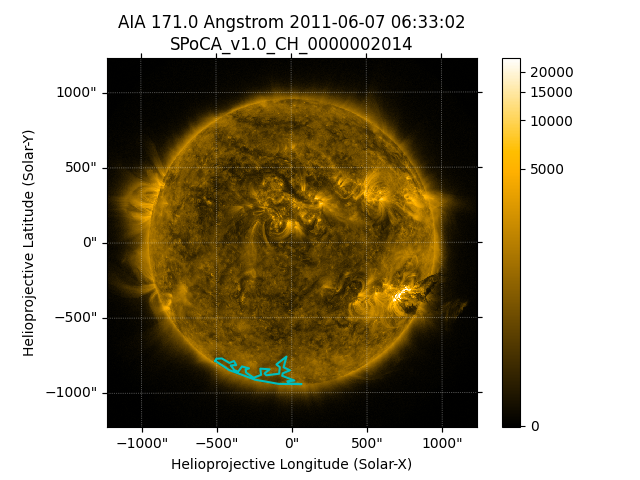
Overplotting HEK feature/event polygons on a map#
How to overplot HEK outlines on a map.
import matplotlib.pyplot as plt
import numpy as np

import astropy.units as u
from astropy.time import TimeDelta

import sunpy.data.sample
import sunpy.map
from sunpy.net import attrs as a
from sunpy.net import hek
from sunpy.physics.differential_rotation import solar_rotate_coordinate
We start with the sample data.
Look for coronal holes detected using the SPoCA feature recognition method:
hek_client = hek.HEKClient()
start_time = aia_map.date - TimeDelta(2*u.hour)
end_time = aia_map.date + TimeDelta(2*u.hour)
responses = hek_client.search(a.Time(start_time, end_time),
                              a.hek.CH, a.hek.FRM.Name == 'SPoCA')
Let’s find the biggest coronal hole within 80 degrees north/south of the equator:
Next let’s get the boundary of the coronal hole.
ch = responses[response_index]
ch_boundary = responses[response_index]["hpc_boundcc"]
The coronal hole was detected at different time than the AIA image was taken so we need to rotate it to the map observation time.
/home/docs/checkouts/readthedocs.org/user_builds/sunpy/conda/latest/lib/python3.13/site-packages/sunpy/physics/differential_rotation.py:91: SunpyUserWarning: Using 'time' assumes an Earth-based observer.
  warn_user("Using 'time' assumes an Earth-based observer.")
Now let’s plot the rotated coronal hole boundary on the AIA map, and fill it with hatching.
fig = plt.figure()
ax = fig.add_subplot(projection=aia_map)
aia_map.plot(axes=ax, clip_interval=(1, 99.99)*u.percent)
ax.plot_coord(rotated_ch_boundary, color='c')
ax.set_title('{:s}\n{:s}'.format(aia_map.name, ch['frm_specificid']))
plt.colorbar()

plt.show()
Total running time of the script: (0 minutes 1.756 seconds)