EVESpWxTimeSeries#
- class sunpy.timeseries.sources.EVESpWxTimeSeries(data, meta=None, units=None, **kwargs)[source]#
Bases:
GenericTimeSeriesSDO EVE LightCurve for level 0CS data.
The Extreme Ultraviolet Variability Experiment (EVE) is an instrument on board the Solar Dynamics Observatory (SDO). The EVE instrument is designed to measure the solar extreme ultraviolet (EUV) irradiance. The EUV radiation includes the 0.1-105 nm range, which provides the majority of the energy for heating Earth’s thermosphere and creating Earth’s ionosphere (charged plasma).
EVE includes several irradiance instruments:
The Multiple EUV Grating Spectrographs (MEGS)-A is a grazing- incidence spectrograph that measures the solar EUV irradiance in the 5 to 37 nm range with 0.1-nm resolution,
The MEGS-B is a normal-incidence, dual-pass spectrograph that measures the solar EUV irradiance in the 35 to 105 nm range with 0.1-nm resolution.
Level 0CS data is primarily used for space weather. It is provided near real-time and is crudely calibrated 1-minute averaged broadband irradiances from ESP and MEGS-P broadband. For other levels of EVE data, use
Fido, withsunpy.net.attrs.Instrument('eve').Data is available starting on 2010/03/01.
Examples
>>> import sunpy.timeseries
>>> import sunpy.data.sample
>>> eve = sunpy.timeseries.TimeSeries(sunpy.data.sample.EVE_TIMESERIES, source='EVE')
>>> eve = sunpy.timeseries.TimeSeries("http://lasp.colorado.edu/eve/data_access/evewebdata/quicklook/L0CS/LATEST_EVE_L0CS_DIODES_1m.txt", source='EVE')
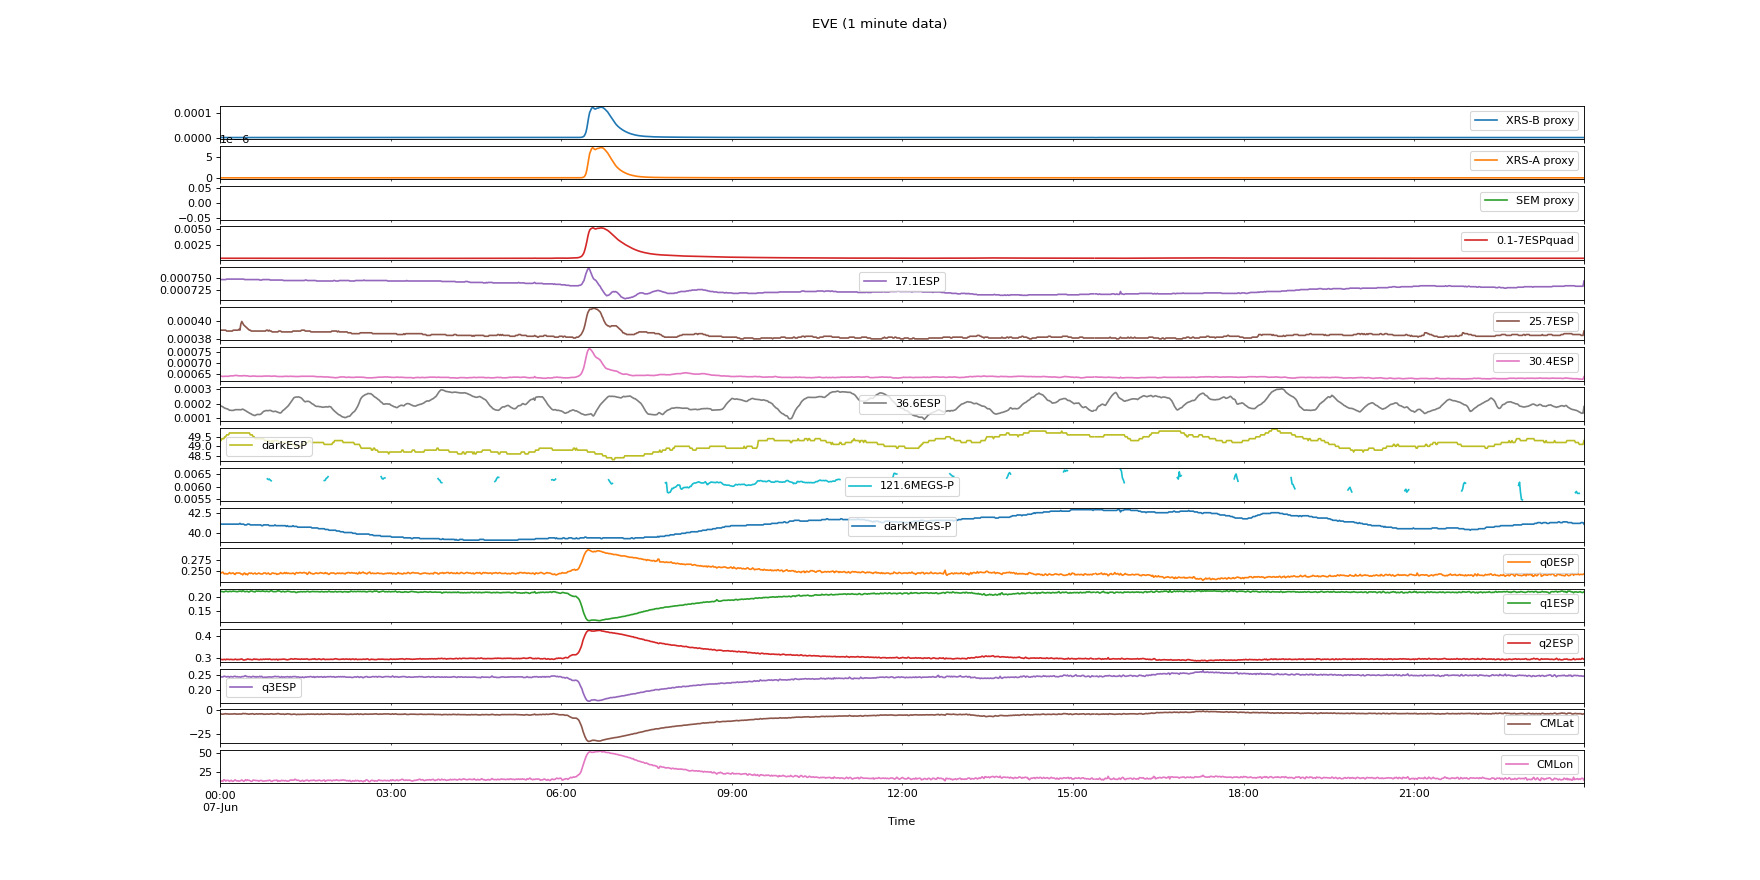
>>> eve.peek(subplots=True)
References
Methods Summary
is_datasource_for(**kwargs)Determines if header corresponds to an EVE image.
peek(*[, columns])Plots the time series in a new figure.
Methods Documentation
- peek(*, columns=None, **kwargs)[source]#
Plots the time series in a new figure.
(
Source code,png,hires.png,pdf)
- Parameters:
columns (list[str], optional) – If provided, only plot the specified columns.
**kwargs (
dict) – Additional plot keyword arguments that are handed topandas.DataFrame.plot().