Example Gallery#
The gallery contains examples of how to use sunpy. Each example is a short and self contained how-to guide for performing a specific task.
Sample data#
Some of these examples require the SunPy sample data, which are downloaded as needed via the module sunpy.data.sample.
If you want to download all of the sample data files in advance, call sunpy.data.sample.download_all().
Acquiring Data#
Examples of downloading solar data located on remote servers


Searching for EPD/EPT data with the a.soar.Sensor attribute

Searching for Solar Orbiter data using Solar Distance attribute

Searching for Solar Orbiter data using Wavelength and Detector attributes
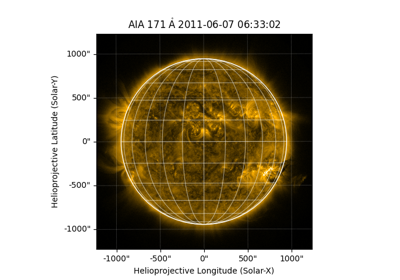
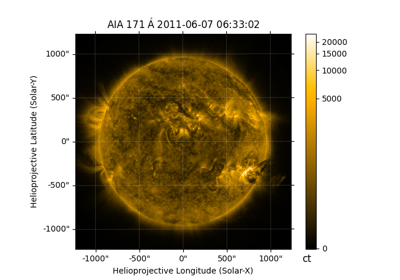
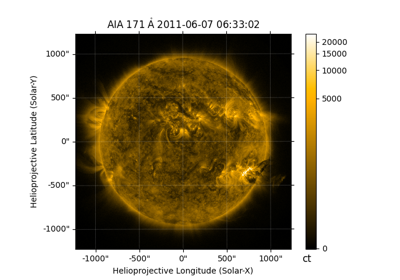
Map#
Examples using Map with solar data


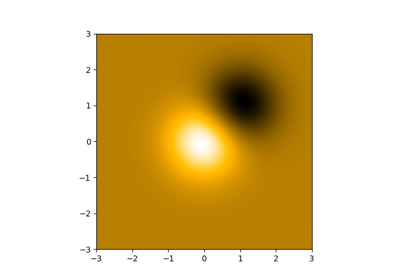
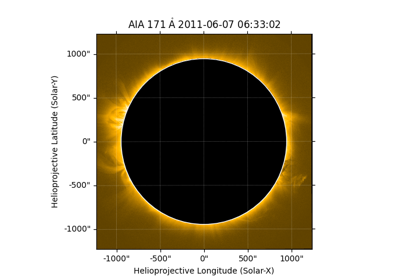
Segmenting a Map based on transformation of coordinates

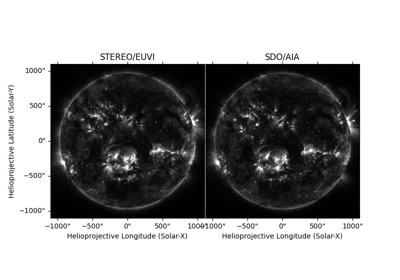
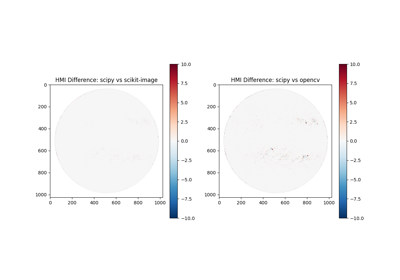
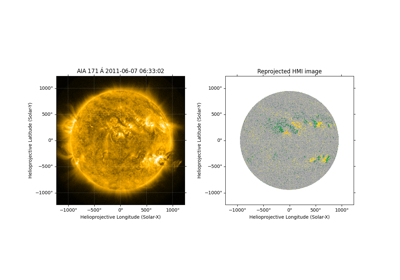
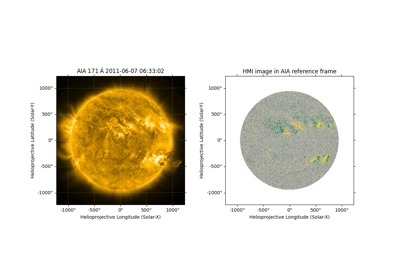
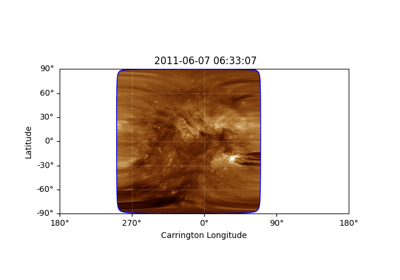
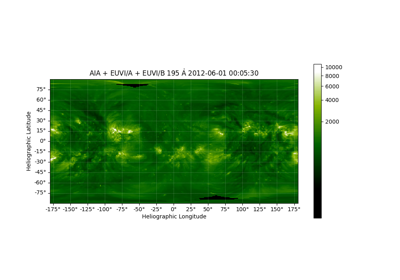
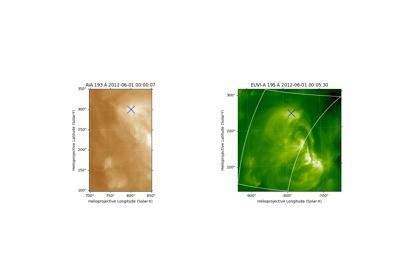
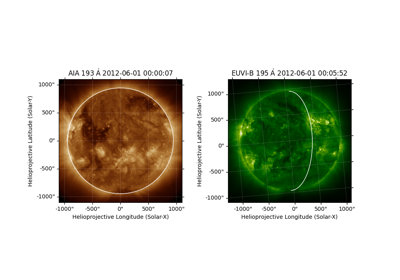
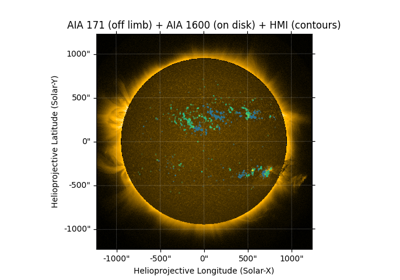
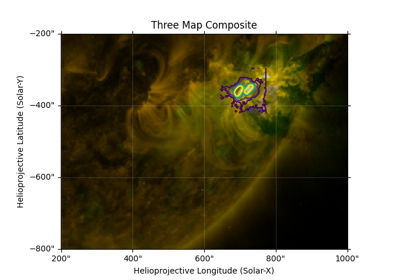
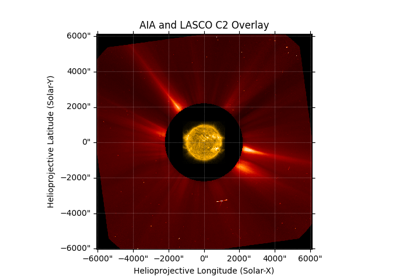
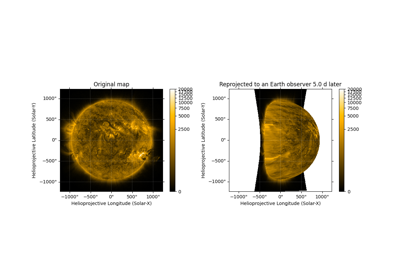
Combining, Co-aligning, and Reprojecting Images#
Examples of combining, aligning, and reprojecting sunpy maps
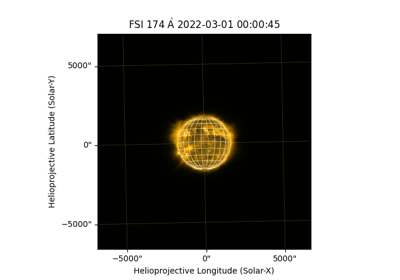
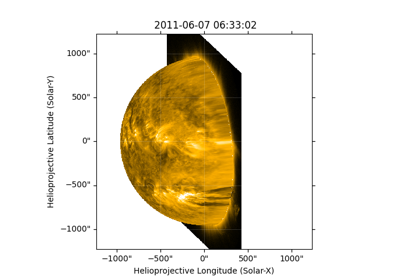
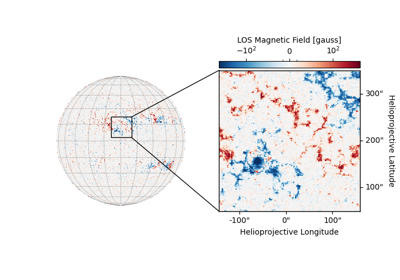
Downloading and Reprojecting a Solar Orbiter PHI/HRT Magnetogram
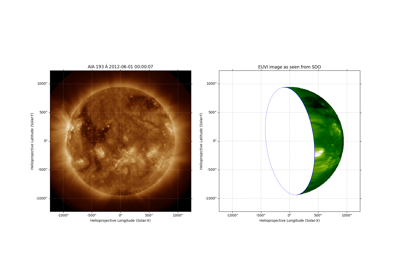

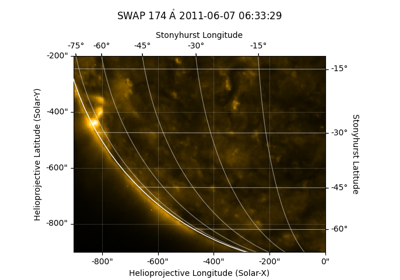
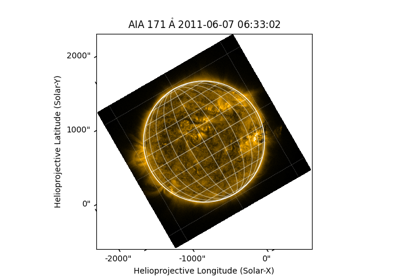
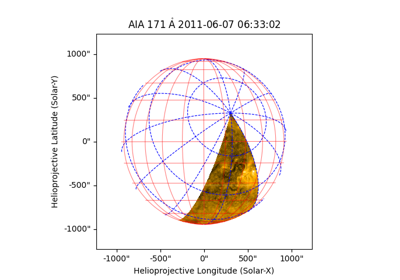
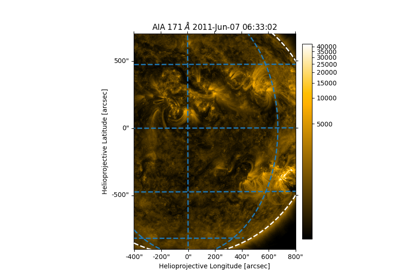
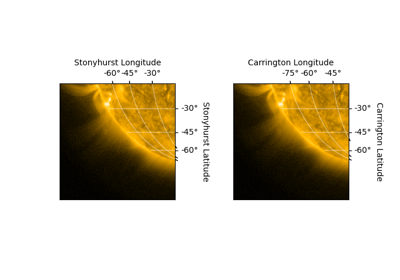
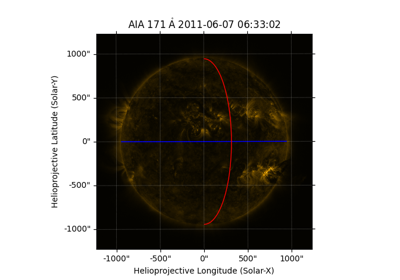
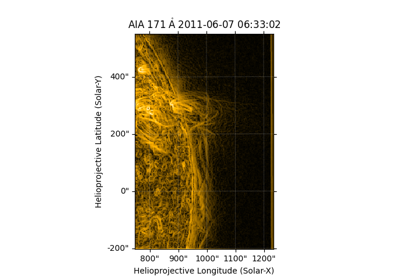
Reprojecting a Helioprojective Map to Helioprojective Radial
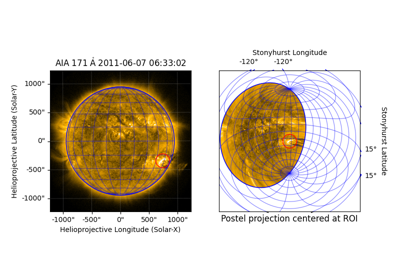
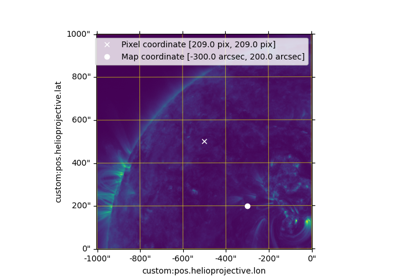
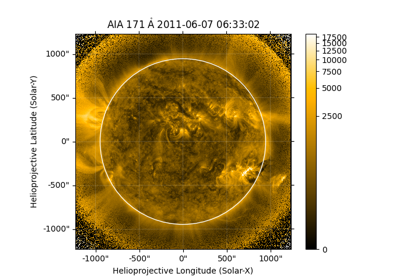
Reprojecting to a Map Projection with a Custom Origin

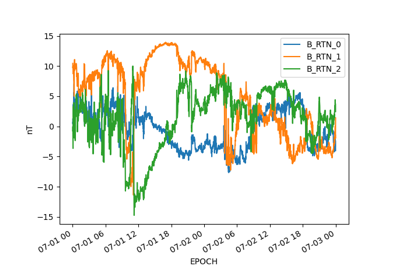
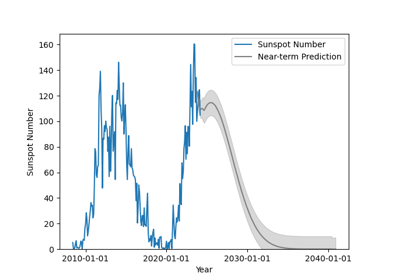
Time Series#
Examples using TimeSeries
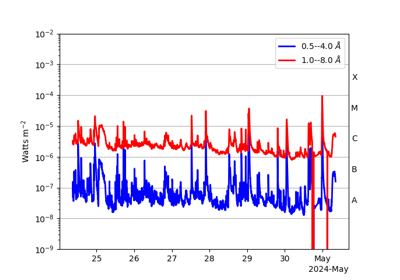
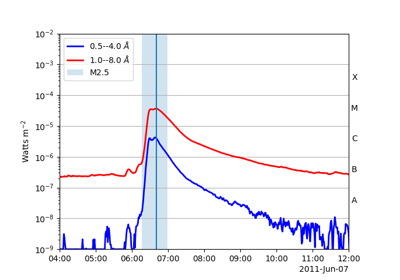
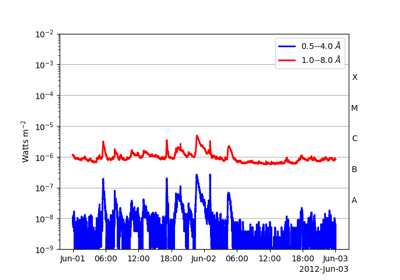
Creating a TimeSeries from GOES-XRS near real time data with flare times
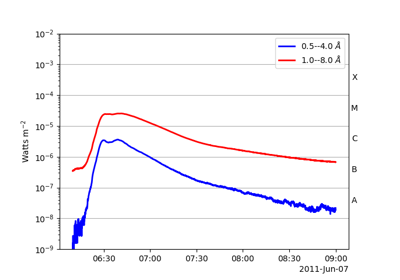
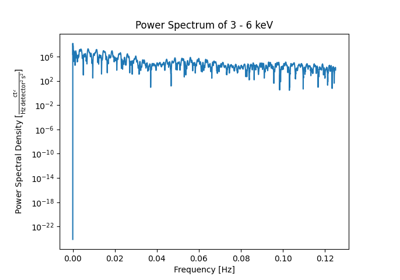
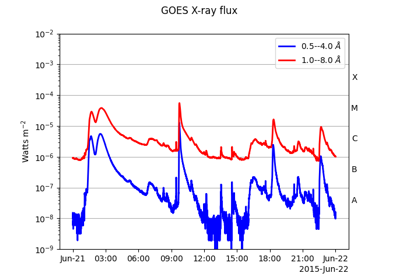
Retrieving and analyzing GOES X-Ray Sensor (XRS) data
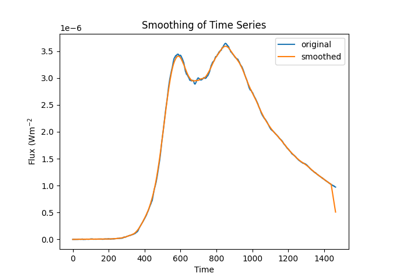
Smoothing of timeSeries data using convolution filters

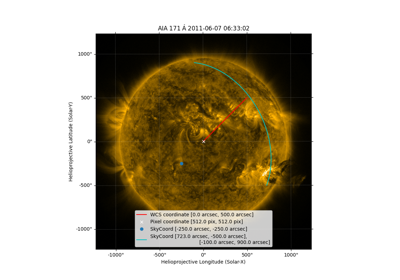
Coordinates, times, and units#
Examples of working with coordinate information, times, and scientific units
Converting between Helioprojective and AltAz Coordinate
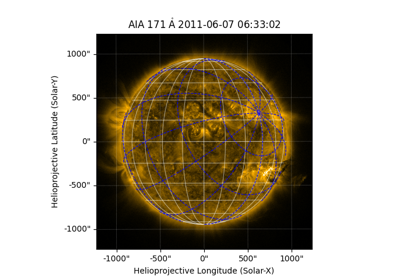
Create a Helioprojective Map from observations in the RA-DEC coordinate system
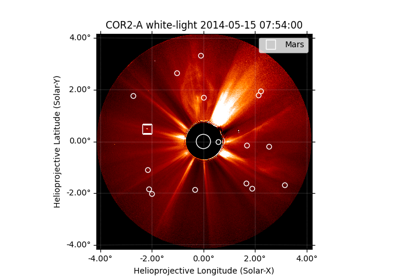
Identifying stars in a STEREO/SECCHI COR2 coronagraph image
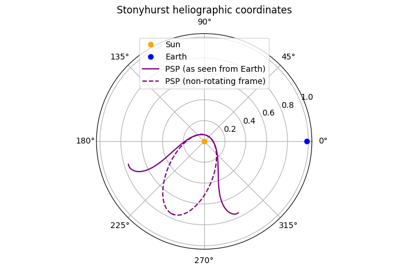
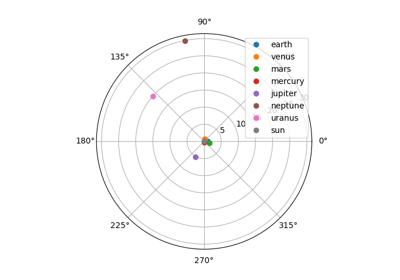
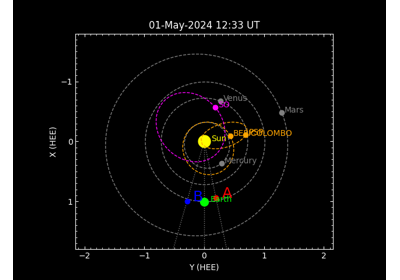
Obtaining a spacecraft trajectory from JPL Horizons
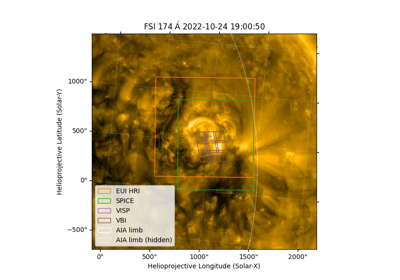
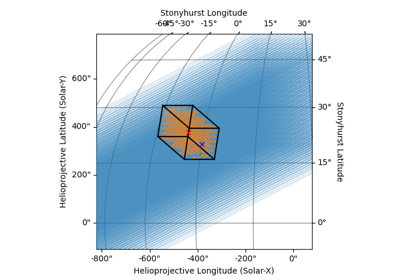
Plotting Fields of View of Solar Orbiter and DKIST
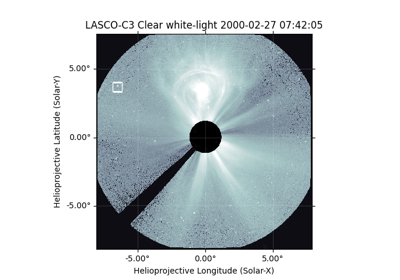
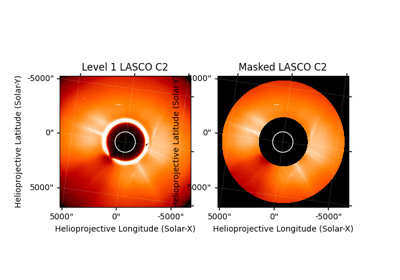
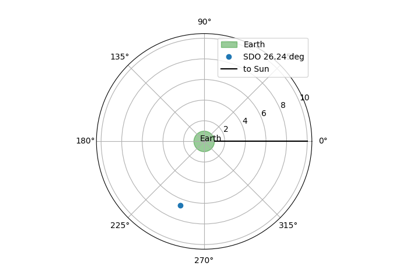
Setting the correct position for SOHO in a LASCO C3 Map
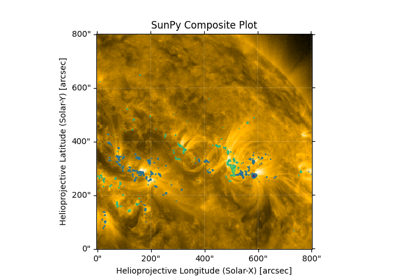
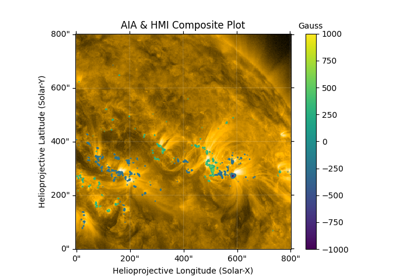
Plotting#
Examples of visualizing supported data types


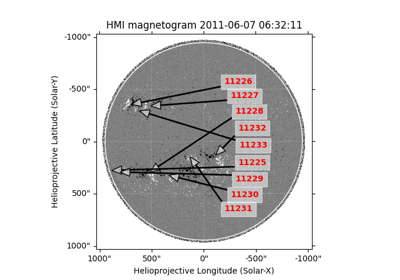
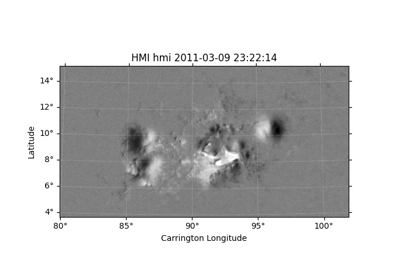
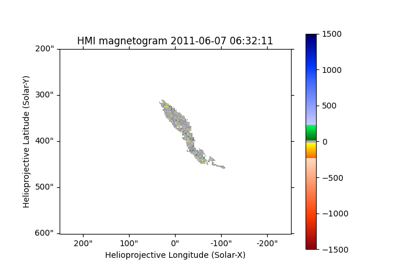
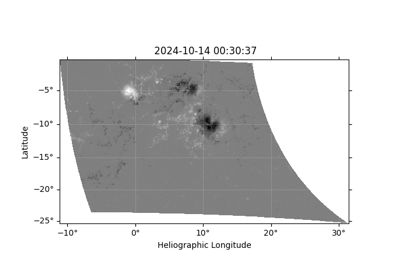
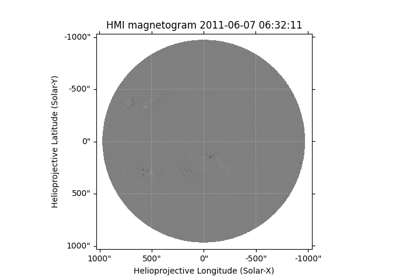
Overplotting SRS active region locations on a magnetograms

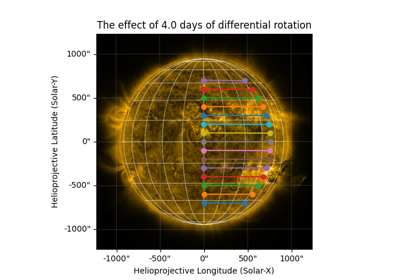
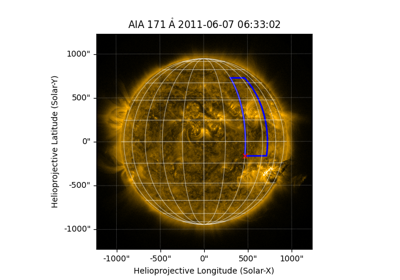
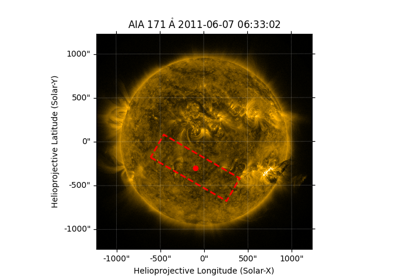
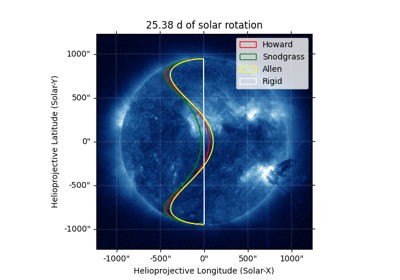
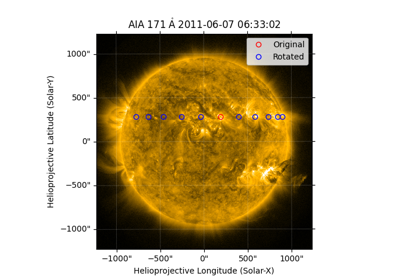
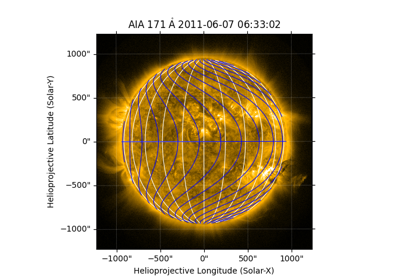
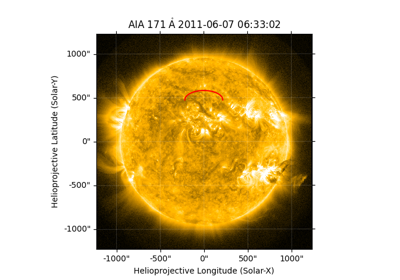
Differential Rotation of the Sun#
Examples of accounting for differential rotation (i.e., the latitude-dependent rotation rate of the Sun) in the coordinates framework
Saving and Loading Data#
Examples of saving and loading data

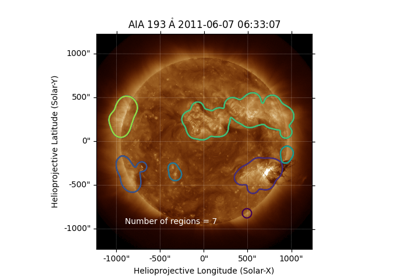
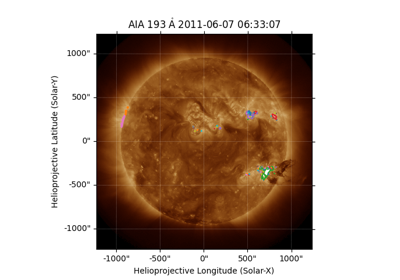
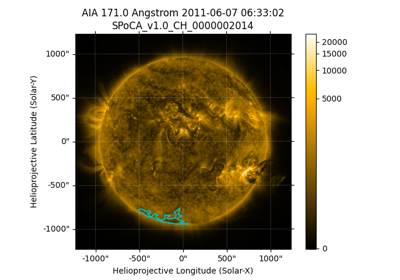
Computer Vision Techniques#
Examples of using computer vision techniques to analyze solar data
Showcase#
Examples that use an advanced combination of capabilities in sunpy


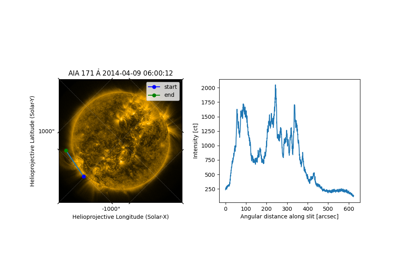
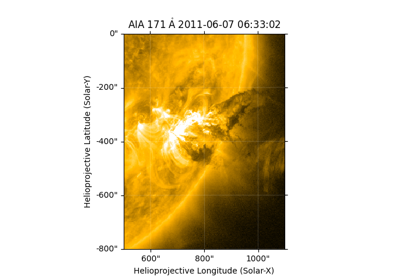
Creating a time-distance plot from a sequence of maps
Understanding Observer Orientation Relative to a Simulated Volume with astropy.coordinates