Note
Go to the end to download the full example code.
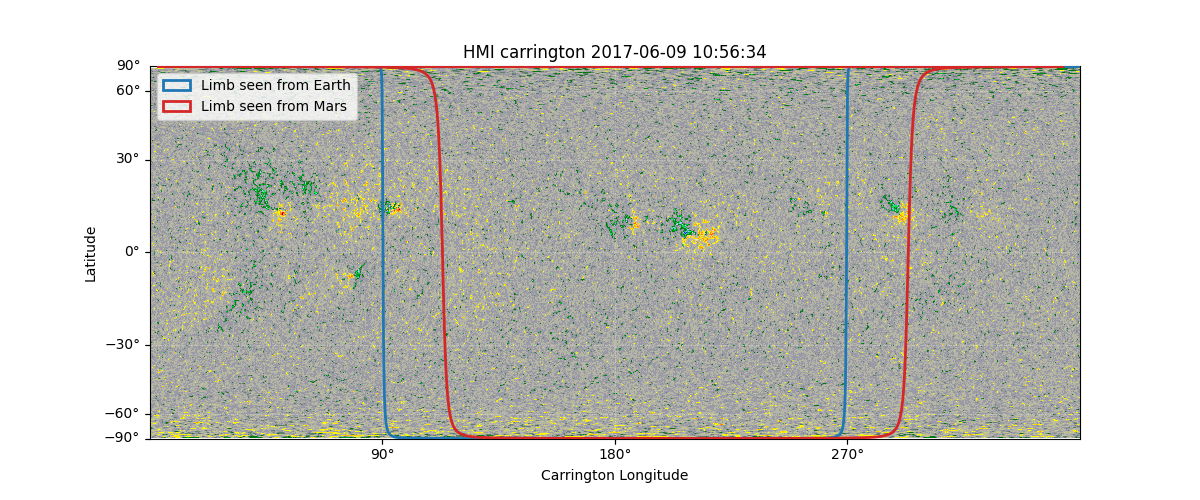
Plotting the solar limb#
This example demonstrates how you can draw the limb as seen by an arbitrary observer.
import matplotlib.pyplot as plt

import sunpy.map
from sunpy.coordinates import get_body_heliographic_stonyhurst
from sunpy.visualization import drawing
Let’s download a magnetic field synoptic map and read it into a Map.
syn_map = sunpy.map.Map('http://jsoc.stanford.edu/data/hmi/synoptic/hmi.Synoptic_Mr.2191.fits')
syn_map.plot_settings['cmap'] = 'hmimag'
syn_map.plot_settings['norm'] = plt.Normalize(-1500, 1500)
Get coordinates for Earth and Mars at the date of the synoptic map
Now we can plot the map the the solar limb seen from these two coordinates.
To create a legend for these limbs, we need to keep the patches returned by
limb() and provide them to
legend().
fig = plt.figure(figsize=(12, 5))
ax = fig.add_subplot(projection=syn_map)
im = syn_map.plot(axes=ax)

visible_limbs = []
for (body, coord), color in zip(coords.items(), ['tab:blue', 'tab:red']):
    v, _ = drawing.limb(ax, coord, color=color, label=f'Limb seen from {body}', linewidth=2)
    visible_limbs.append(v)

ax.legend(handles=visible_limbs)
plt.show()
/home/docs/checkouts/readthedocs.org/user_builds/sunpy/conda/latest/lib/python3.13/site-packages/sunpy/map/mapbase.py:671: SunpyMetadataWarning: Missing metadata for observer: assuming Earth-based observer.
For frame 'heliographic_stonyhurst' the following metadata is missing: hglt_obs,dsun_obs,hgln_obs
For frame 'heliographic_carrington' the following metadata is missing: crln_obs,crlt_obs,dsun_obs

  obs_coord = self.observer_coordinate
Total running time of the script: (0 minutes 2.089 seconds)