Note
Go to the end to download the full example code.
Aligning AIA and HMI Data with Reproject#
This example shows how to reproject one image to be aligned with another image.
Here we use the reproject package to transform one image to the reference frame of another image. The reference frames are defined by the respective World Coordinate System (WCS) information. This is a very generic way of aligning data, and can be very accurate.
You will need reproject v0.6 or higher installed.
See Auto-Aligning AIA and HMI Data During Plotting for an alternate approach to image alignment, where the images are aligned as they are plotted, with no modified map created.
import matplotlib.pyplot as plt

import astropy.units as u

import sunpy.data.sample
import sunpy.map
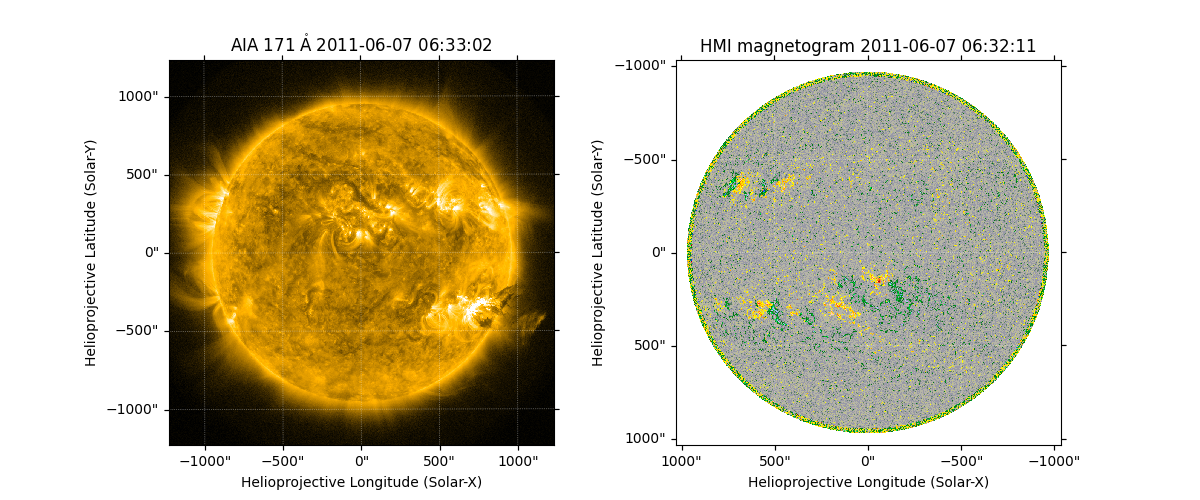
We use the AIA image and HMI image from the sample data. For the HMI map, we use the special HMI color map, which expects the plotted range to be -1500 to 1500.
map_aia = sunpy.map.Map(sunpy.data.sample.AIA_171_IMAGE)
map_hmi = sunpy.map.Map(sunpy.data.sample.HMI_LOS_IMAGE)
map_hmi.plot_settings['cmap'] = "hmimag"
map_hmi.plot_settings['norm'] = plt.Normalize(-1500, 1500)
Plot both images side by side.
fig = plt.figure(figsize=(12, 5))
ax1 = fig.add_subplot(121, projection=map_aia)
map_aia.plot(axes=ax1, clip_interval=(1, 99.9)*u.percent)
ax2 = fig.add_subplot(122, projection=map_hmi)
map_hmi.plot(axes=ax2)
<matplotlib.image.AxesImage object at 0x744fa6e6e710>
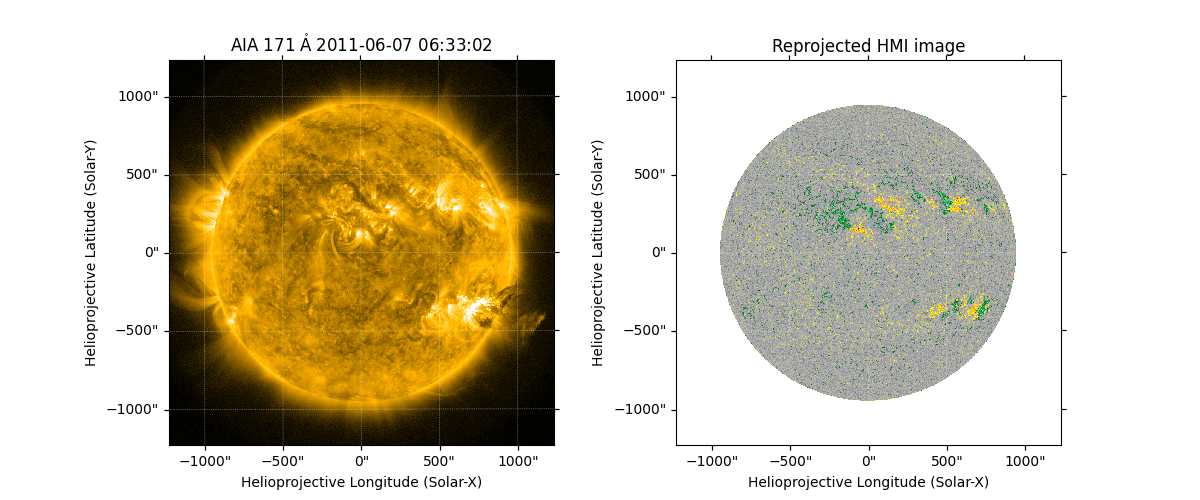
We can now reproject the HMI image to the WCS of the AIA image. We are using
the fast reproject_interp, however the slower but most accurate
reproject_exact would also work well here. The
reproject_exact function only works when reprojecting between
two WCSes with the same observer, which makes it well suited to aligning
data.
out_hmi = map_hmi.reproject_to(map_aia.wcs)
Plot the images side by side.
Note that off-disk HMI data are not retained by default because an
additional assumption is required to define the location of the HMI
emission in 3D space. We can use SphericalScreen
to retain the off-disk HMI data. See
Reprojecting Using a Spherical Screen
for more reference.
fig = plt.figure(figsize=(12, 5))
ax1 = fig.add_subplot(121, projection=map_aia)
map_aia.plot(axes=ax1, clip_interval=(1, 99.9)*u.percent)
ax2 = fig.add_subplot(122, projection=out_hmi)
out_hmi.plot(axes=ax2, title='Reprojected HMI image')
<matplotlib.image.AxesImage object at 0x744fa68c16d0>
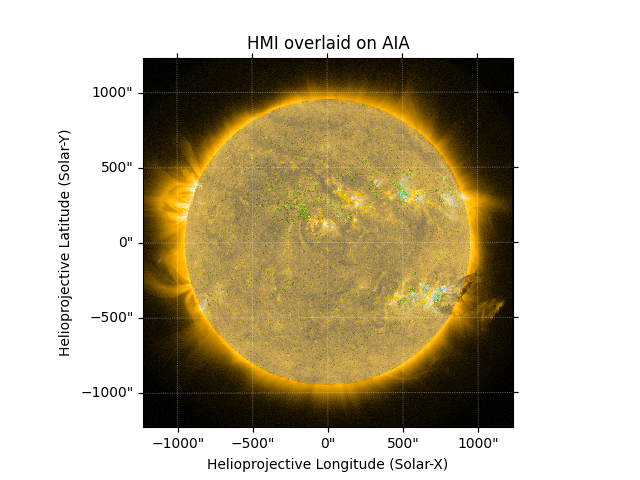
As both of these images are now on the same pixel grid we can directly plot them over one another, by setting the transparency of the HMI plot.
fig = plt.figure()
ax1 = fig.add_subplot(projection=map_aia)
map_aia.plot(axes=ax1, clip_interval=(1, 99.9)*u.percent)
out_hmi.plot(axes=ax1, alpha=0.5)
plt.title('HMI overlaid on AIA')

plt.show()
Total running time of the script: (0 minutes 2.128 seconds)