Note
Go to the end to download the full example code
Plotting a Map without any Axes#
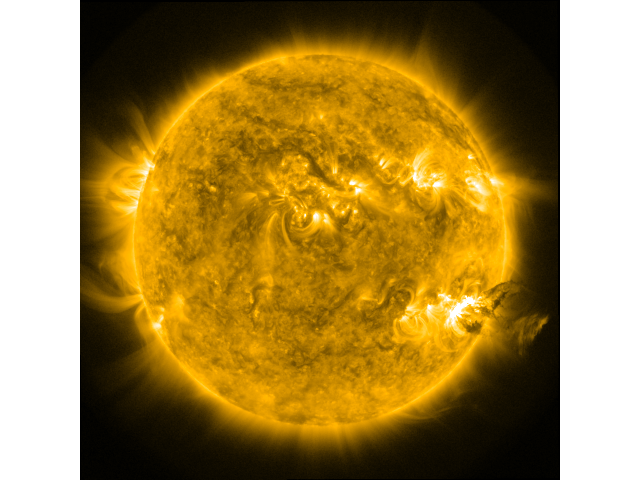
This examples shows you how to plot a Map without any annotations at all, i.e., to save as an image.
import matplotlib.pyplot as plt
import numpy as np

import sunpy.map
from sunpy.data.sample import AIA_171_IMAGE
Create a sunpy Map from the sample data.
smap = sunpy.map.Map(AIA_171_IMAGE)
Plot the Map without a frame. We can setup a frameless figure and an axes which spans the whole canvas.
figure = plt.figure(frameon=False)
ax = plt.axes([0, 0, 1, 1])
# Disable the axis
ax.set_axis_off()

# Plot the map.
# Since we are not interested in the exact map coordinates,
# we can simply use :meth:`~matplotlib.Axes.imshow`.
norm = smap.plot_settings['norm']
norm.vmin, norm.vmax = np.percentile(smap.data, [1, 99.9])
ax.imshow(smap.data,
          norm=norm,
          cmap=smap.plot_settings['cmap'],
          origin="lower")
<matplotlib.image.AxesImage object at 0x7f52e32dace0>
At this point you could save the figure with savefig()
or show it:
plt.show()

Total running time of the script: (0 minutes 0.228 seconds)