Note
Go to the end to download the full example code.
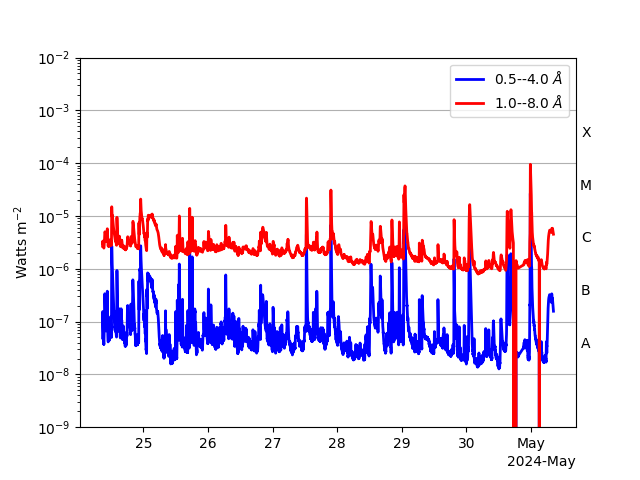
Creating a TimeSeries from GOES-XRS near real time data with flare times#
This example will demonstrate how to make use of GOES XRS Near Real Time data. This includes the goes XRS timeseries data as well as the flare times. The real-time datasets can all be found at https://services.swpc.noaa.gov/json/goes/primary/
import matplotlib.pyplot as plt
import pandas as pd

from astropy import units as u

from sunpy import timeseries as ts
from sunpy.time import parse_time
We will start by getting reading the GOES-XRS JSON file using pandas.read_json().
This allows us to download the file and load it straight into a pandas.DataFrame.
This file updates every minute and contains the last 7 days worth of data.
There is also a file with only the last 3 days worth of data.
goes_data = pd.read_json(
    "https://services.swpc.noaa.gov/json/goes/primary/xrays-7-day.json"
)
The recorded flux values alternate between the two XRS energy channels: “0.05-0.4nm” and “0.1-0.8nm”. We make a pivot table that naturally rearranges the data into two flux columns. We then rename the columns.
goes_data = goes_data.pivot(
    index='time_tag',
    columns='energy',
    values='observed_flux'
)
goes_data.rename(columns={'0.05-0.4nm': 'xrsa', '0.1-0.8nm': 'xrsb'}, inplace=True)
sunpy.timeseries.TimeSeries requires a datetime index, which we can get by
parsing the time strings.
goes_data.index = parse_time(goes_data.index).datetime
sunpy.timeseries.TimeSeries requires that there are units for data variables.
To do this, we will create a dictionary that will map the names of the two columns,
“xrsa” and “xrsb” (the channel names for GOES XRS), to their corresponding
physical flux units, u.W/u.m**2.
We need to create a metadata dictionary for the data.
Typically, sunpy.timeseries.TimeSeries reads the metadata directly from the file.
However, here we need to define our own metadata and we will keep it fairly simple.
meta = dict(
    {"instrument": "GOES X-ray sensor", "measurements": "primary", "type": "quicklook"}
)
Now we will create a sunpy.timeseries.TimeSeries by passing in the data,
the metadata and the units.
NOAA also provides the past 7 days of flare event identifications which we can also parse. Note that it is possible that no flares occurred in the last 7 days.
flare_events = pd.read_json(
    "https://services.swpc.noaa.gov/json/goes/primary/xray-flares-7-day.json"
)
Next we sort the list and retain the five largest flares.
if len(flare_events) > 0:
    largest_flares = flare_events.sort_values('max_xrlong', ascending=False)[:5]
else:
    largest_flares = []
Finally, we plot the timeseries and overlay the largest flares that occurred.
fig, ax = plt.subplots()
goes_ts.plot(axes=ax)
if len(largest_flares) > 0:
    for _, this_flare in largest_flares.iterrows():
        peak_time = parse_time(this_flare["max_time"])
        ax.axvline(peak_time.datetime, label=f'{peak_time.datetime} {this_flare["max_class"]}')
ax.legend()
ax.set_title(f"Last 7 days of GOES XRS data with the largest {len(largest_flares)} flares labeled")
plt.show()
Total running time of the script: (0 minutes 0.754 seconds)