Note
Go to the end to download the full example code.
Obtaining a spacecraft trajectory from JPL Horizons#
This example shows how to obtain the trajectory of a spacecraft from JPL Horizons and plot it relative to other bodies in the solar system.
JPL Horizons can return the locations of planets and minor bodies (e.g., asteroids) in the solar system, and it can also return the location of a variety of major spacecraft.
import matplotlib.pyplot as plt

import astropy.units as u

from sunpy.coordinates import get_body_heliographic_stonyhurst, get_horizons_coord
from sunpy.time import parse_time
We use get_horizons_coord() to query JPL Horizons
for the trajectory of Parker Solar Probe (PSP). Let’s request 50 days on
either side of PSP’s 14th closest approach to the Sun.
perihelion_14 = parse_time('2022-12-11 13:16')
psp = get_horizons_coord('Parker Solar Probe',
                         {'start': perihelion_14 - 50 * u.day,
                          'stop': perihelion_14 + 50 * u.day,
                          'step': '180m'})
We also obtain the location of Earth at PSP perihelion. We could query
JPL Horizons again, but get_body_heliographic_stonyhurst() returns
a comparably accurate location using the Astropy ephemeris.
earth = get_body_heliographic_stonyhurst('Earth', perihelion_14)
For the purposes of plotting on a Matplotlib polar plot, we create a short convenience function to extract the necessary values in the appropriate units.
def coord_to_polar(coord):
    return coord.lon.to_value('rad'), coord.radius.to_value('AU')
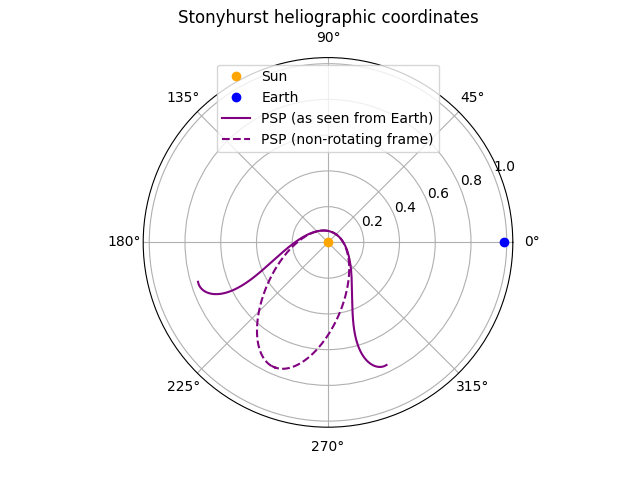
Finally, we plot the trajectory on a polar plot. Be aware that the
orientation of the Stonyhurst heliographic coordinate system rotates
over time such that the Earth is always at zero longitude.
Accordingly, when we directly plot the trajectory, it does not appear
as a simple ellipse because each trajectory point has a different
observation time and thus a different orientation of the coordinate
system. To see the elliptical orbit, the trajectory can be
transformed to the coordinate frame of Earth at the single time of
PSP perihelion (earth), so that the trajectory is represented in
a non-rotating coordinate frame.
fig = plt.figure()
ax = fig.add_subplot(projection='polar')
ax.plot(0, 0, 'o', label='Sun', color='orange')
ax.plot(*coord_to_polar(earth), 'o', label='Earth', color='blue')
ax.plot(*coord_to_polar(psp),
        label='PSP (as seen from Earth)', color='purple')
ax.plot(*coord_to_polar(psp.transform_to(earth)),
        label='PSP (non-rotating frame)', color='purple', linestyle='dashed')
ax.set_title('Stonyhurst heliographic coordinates')
ax.legend(loc='upper center')

plt.show()
There are other tools that enable a similar style of figure. solarmach is one such example.
Total running time of the script: (0 minutes 1.026 seconds)