Note
Go to the end to download the full example code.
Comparing Map Rotation Functions#
This example will compare between the current library implementations for sunpy.map.GenericMap.rotate.
import matplotlib.pyplot as plt

import astropy.units as u

import sunpy.data.sample
import sunpy.map
Rotating a map in sunpy has a choice between three libraries: scipy (the default),
scikit-image and opencv. Furthermore, one can also create a custom rotation
function and register it for use with rotate(),
see Adding a new rotation method.
Defining an appropriate metric to compare different algorithms is challenging. This example will just compare the raw value differences.
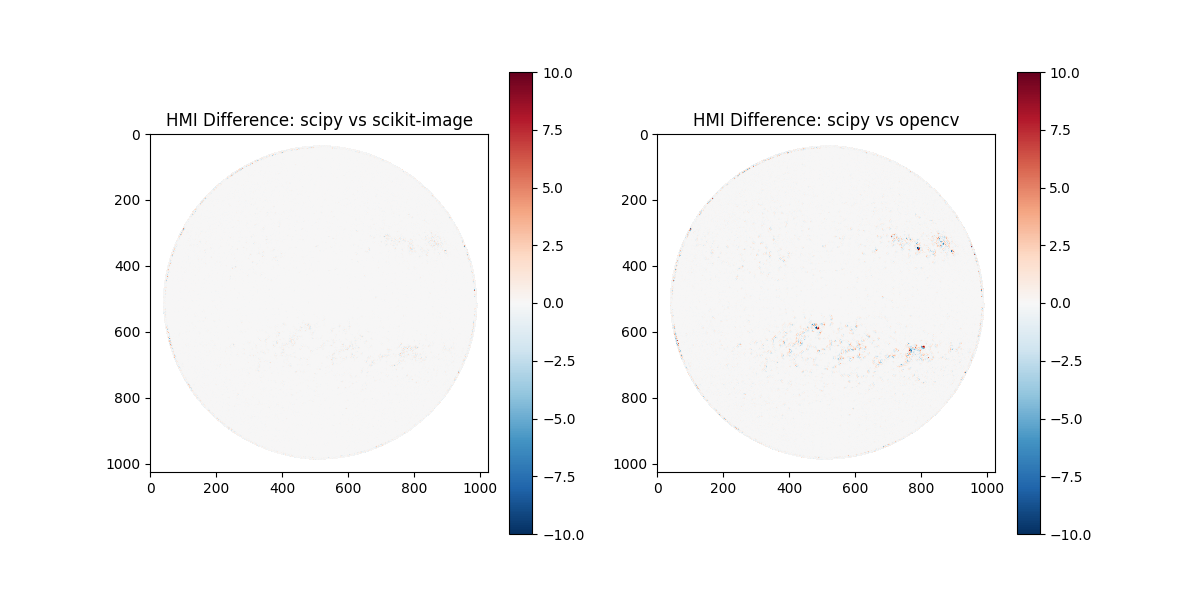
Using an HMI sample data, we will do a rotation to align the image to the north. By default, the order of rotation is 3.
hmi_map = sunpy.map.Map(sunpy.data.sample.HMI_LOS_IMAGE)

scipy_map = hmi_map.rotate(method='scipy')
skimage_map = hmi_map.rotate(method='scikit-image')
cv2_map = hmi_map.rotate(method='opencv')
Now for a visual comparison, the raw differences, that should highlight the differences. Note that only two comparisons are shown. Note the scale here is ± 10.
fig, (ax1, ax2) = plt.subplots(1, 2, figsize=(12, 6))

img1 = ax1.imshow(scipy_map.data - skimage_map.data, cmap='RdBu_r', vmin=-10, vmax=10)
ax1.set_title("HMI Difference: scipy vs scikit-image")
fig.colorbar(img1, ax=ax1)

img2 = ax2.imshow(scipy_map.data - cv2_map.data, cmap='RdBu_r', vmin=-10, vmax=10)
ax2.set_title("HMI Difference: scipy vs opencv")
fig.colorbar(img2, ax=ax2)

plt.show()
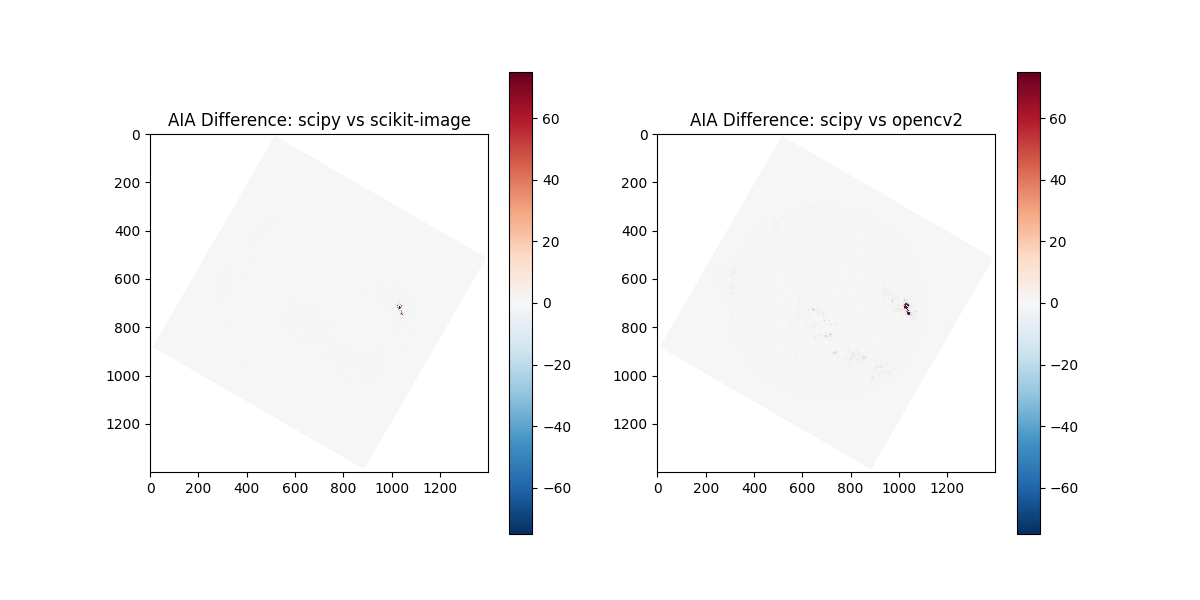
We can repeat this but for AIA data, using a 171 sample image. We will rotate it by the large amount of 30 degrees.
aia_map = sunpy.map.Map(sunpy.data.sample.AIA_171_IMAGE)

scipy_map = aia_map.rotate(30*u.deg, method='scipy')
skimage_map = aia_map.rotate(30*u.deg, method='scikit-image')
cv2_map = aia_map.rotate(30*u.deg, method='opencv')
Now for a visual comparison, the raw differences, that should highlight the differences. Note that only two comparisons are shown. Note the scale here is ± 75.
fig, (ax1, ax2) = plt.subplots(1, 2, figsize=(12, 6))

img1 = ax1.imshow(scipy_map.data - skimage_map.data, cmap='RdBu_r', vmin=-75, vmax=75)
ax1.set_title("AIA Difference: scipy vs scikit-image")
fig.colorbar(img1, ax=ax1)

img2 = ax2.imshow(scipy_map.data - cv2_map.data, cmap='RdBu_r', vmin=-75, vmax=75)
ax2.set_title("AIA Difference: scipy vs opencv2")
fig.colorbar(img2, ax=ax2)

plt.show()
Total running time of the script: (0 minutes 1.572 seconds)