Note
Go to the end to download the full example code.
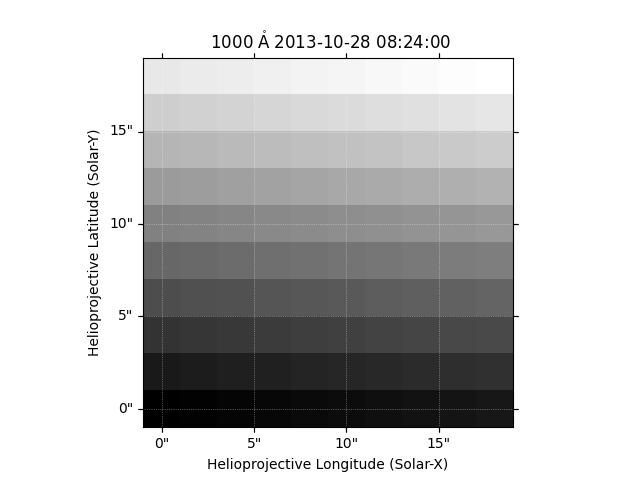
Generating a map from data array#
A simple demonstration of creating a map from a numpy array of data.
import matplotlib.pyplot as plt
import numpy as np

import astropy.units as u
from astropy.coordinates import SkyCoord

import sunpy.map
from sunpy.coordinates import frames
Let’s create some data.
Next we need to create the metadata. This is made easier using the
make_fitswcs_header() function which will
create a header object for you. First define the reference coordinate
which requires a time and an observer location.
coord = SkyCoord(0*u.arcsec, 0*u.arcsec, obstime='2013-10-28 08:24',
                 observer='earth', frame=frames.Helioprojective)
Let’s pass that into the helper function along with some parameters. The reference pixel is the pixel is the one at the reference coordinate. The scale sets the size of the pixels. You can also to set a number of other metadata as well such as the instrument name and wavelength.
Let’s now create our map.
manual_map = sunpy.map.Map(data, header)
Let’s plot the result.
fig = plt.figure()
ax = fig.add_subplot(projection=manual_map)
manual_map.plot(axes=ax)
plt.show()
Total running time of the script: (0 minutes 0.089 seconds)