Draw a rectangle on a Map#
sunpy provides a convenient method called draw_quadrangle() to draw rectangles on maps.
In this guide, we will demonstrate four different methods to draw a rectangle on a sunpy.map.Map.
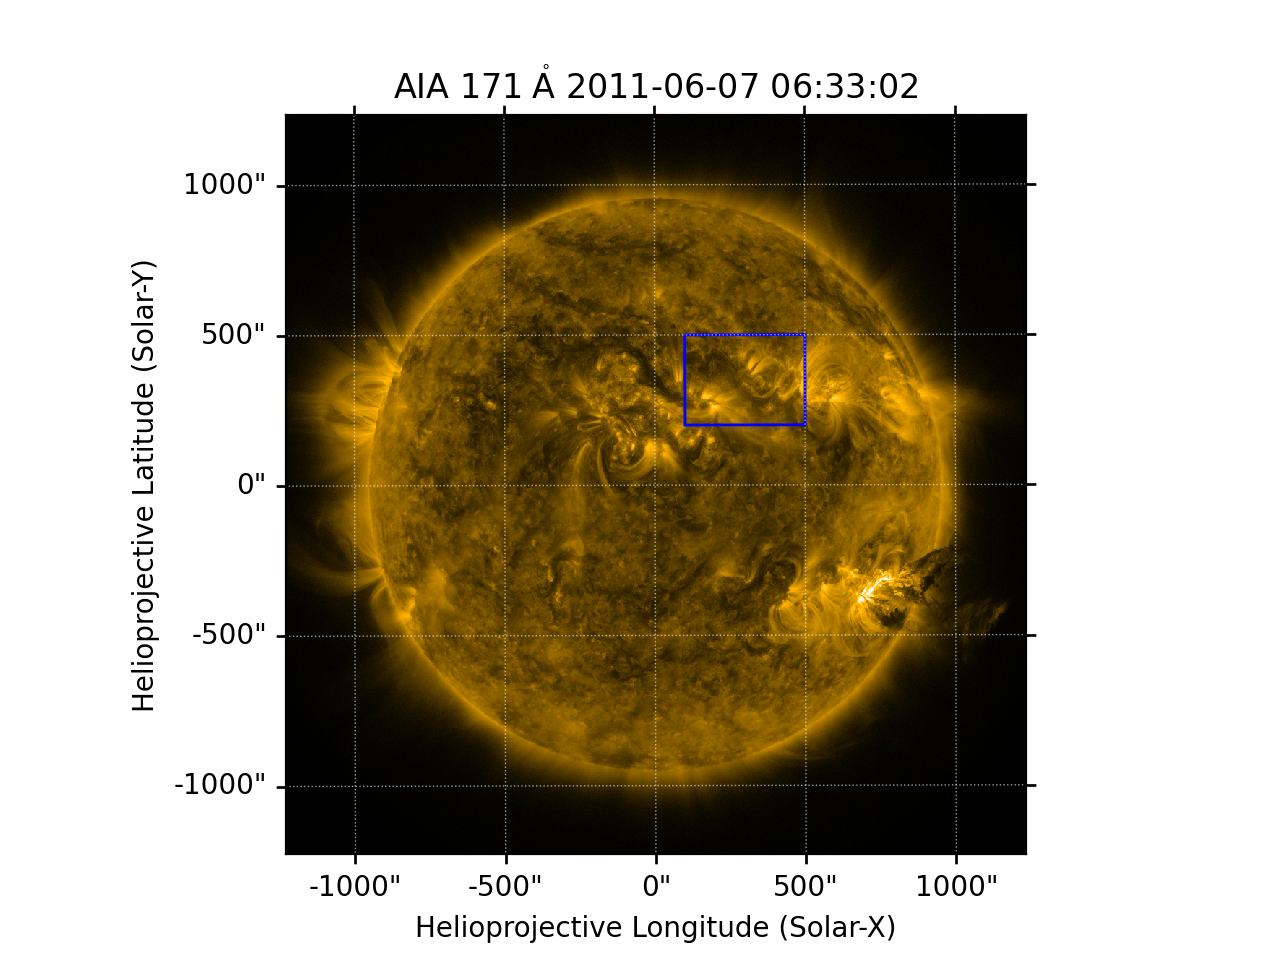
Specify corners with a single SkyCoord#
We will use one SkyCoord to represent the two opposite corners.
import matplotlib.pyplot as plt

import astropy.units as u
from astropy.coordinates import SkyCoord

import sunpy.data.sample
import sunpy.map

aia_map = sunpy.map.Map(sunpy.data.sample.AIA_171_IMAGE)

fig = plt.figure()
ax = fig.add_subplot(projection=aia_map)

aia_map.plot(axes=ax, clip_interval=(1, 99.99)*u.percent)

coords = SkyCoord(Tx=(100, 500) * u.arcsec, Ty=(200, 500) * u.arcsec,frame=aia_map.coordinate_frame)
aia_map.draw_quadrangle(coords, axes=ax, edgecolor="blue")

plt.show()
(Source code, png, hires.png, pdf)

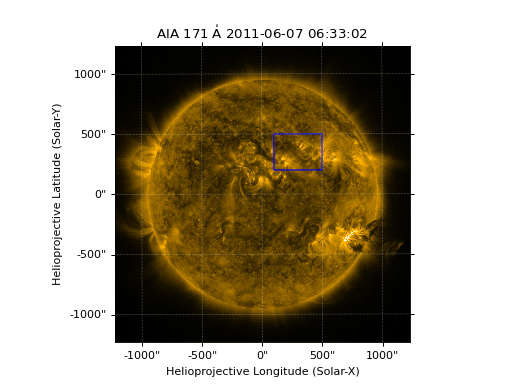
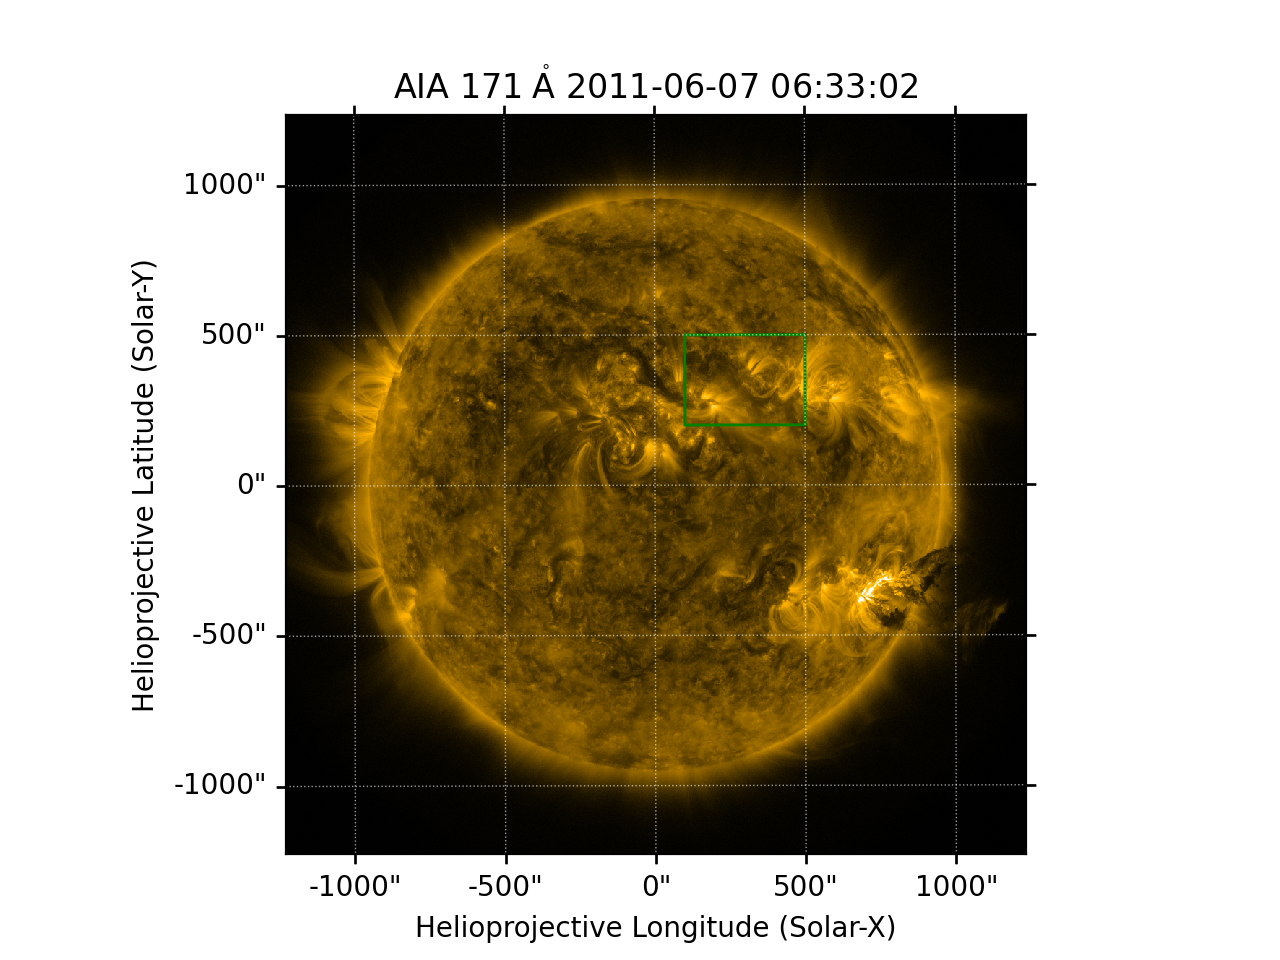
Specify corners with separate SkyCoord#
We will use two SkyCoord to represent the two opposite corners.
fig = plt.figure()
ax = fig.add_subplot(projection=aia_map)

aia_map.plot(axes=ax, clip_interval=(1, 99.99)*u.percent)

bottom_left = SkyCoord(100 * u.arcsec, 200 * u.arcsec, frame=aia_map.coordinate_frame)
top_right = SkyCoord(500 * u.arcsec, 500 * u.arcsec, frame=aia_map.coordinate_frame)
aia_map.draw_quadrangle(bottom_left, axes=ax, top_right=top_right, edgecolor="green")

plt.show()
(Source code, png, hires.png, pdf)
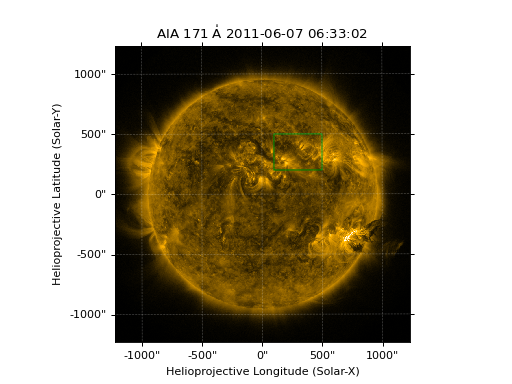
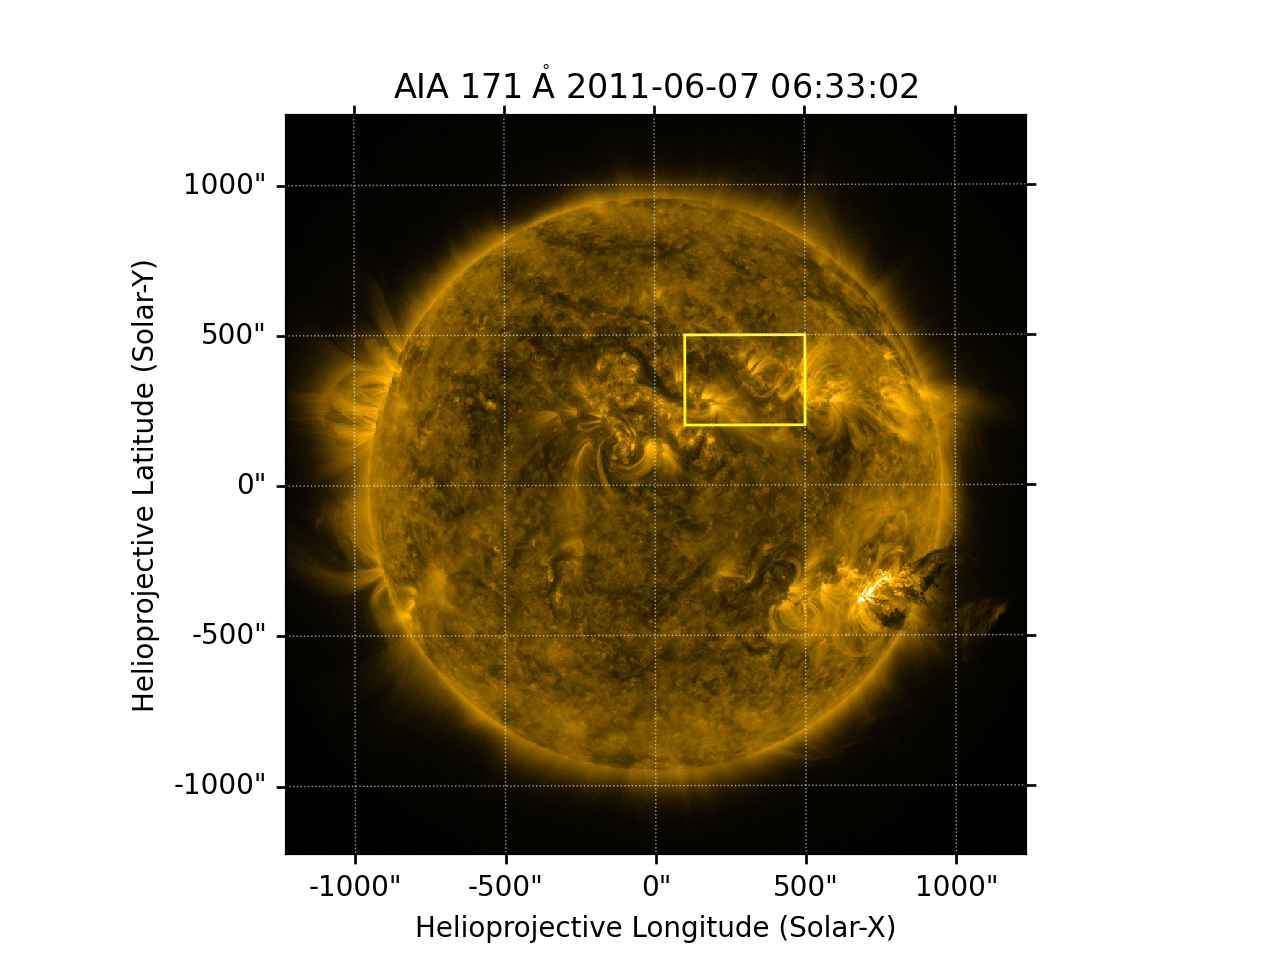
Specify one corner with a width and height#
We will use one SkyCoord to represent the bottom left and supply a width and height to complete the rectangle.
fig = plt.figure()
ax = fig.add_subplot(projection=aia_map)

aia_map.plot(axes=ax, clip_interval=(1, 99.99)*u.percent)

bottom_left = SkyCoord(100 * u.arcsec, 200 * u.arcsec, frame=aia_map.coordinate_frame)
width = 400 * u.arcsec
height = 300 * u.arcsec
aia_map.draw_quadrangle(bottom_left, axes=ax, width=width, height=height, edgecolor="yellow")

plt.show()
(Source code, png, hires.png, pdf)

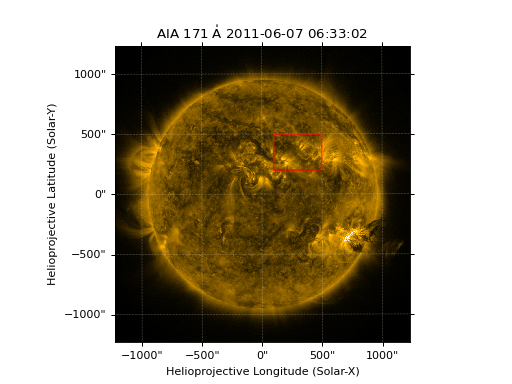
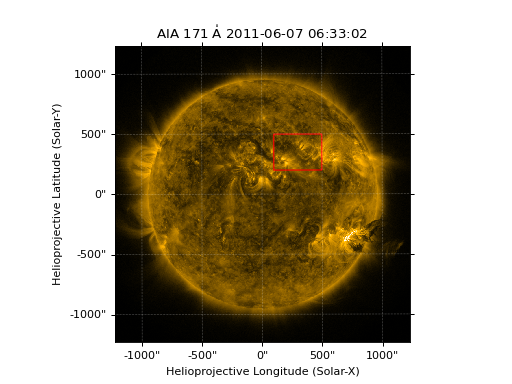
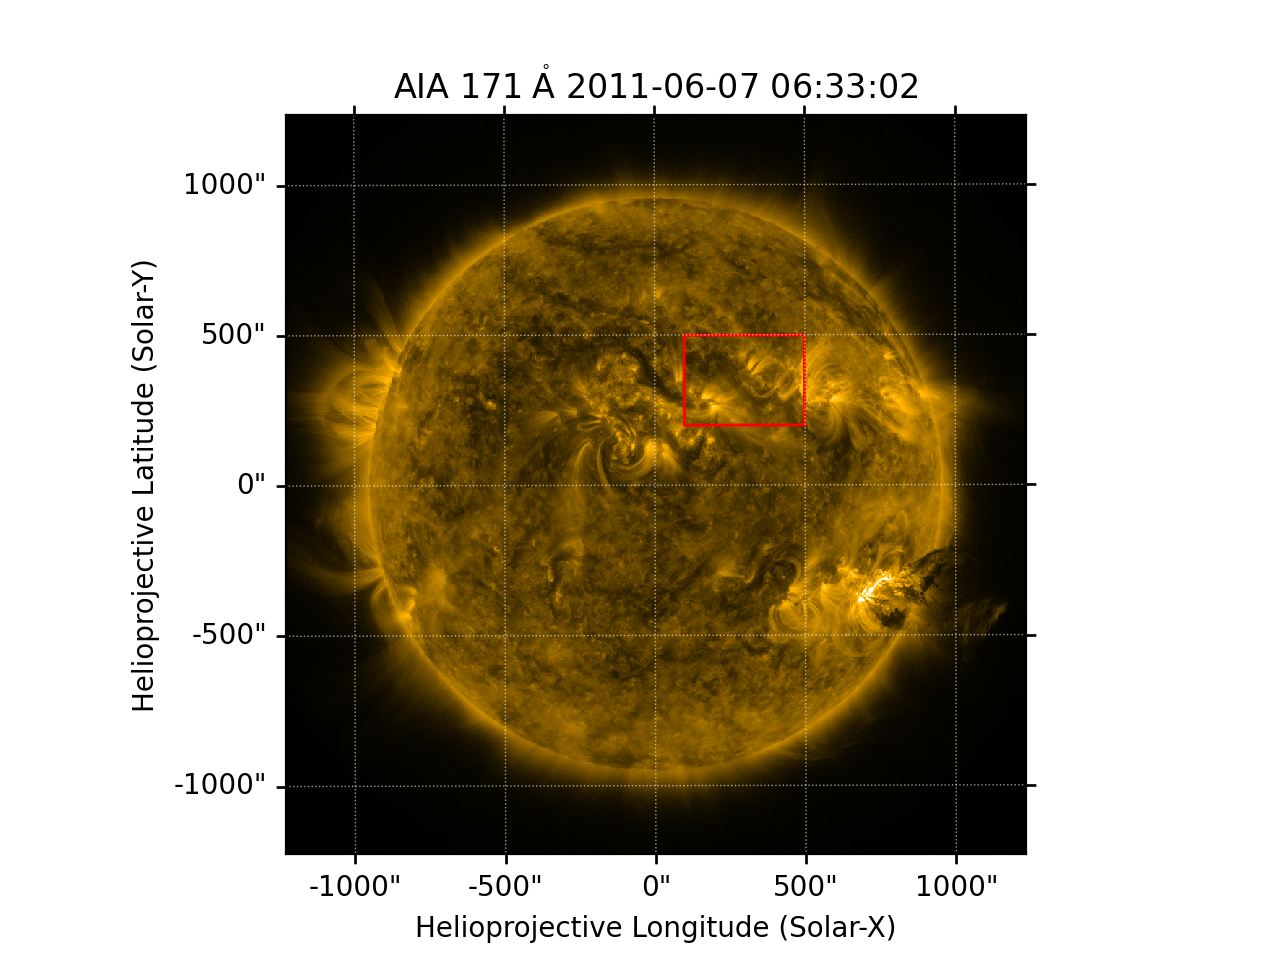
Using pixel coordinates#
We will use a SkyCoord to work out the pixel coordinates instead of using coordinates as we do above.
fig = plt.figure()
ax = fig.add_subplot(projection=aia_map)
aia_map.plot(axes=ax, clip_interval=(1, 99.99)*u.percent)

bottom_left = aia_map.wcs.pixel_to_world(551 * u.pixel, 594 * u.pixel)
top_right = aia_map.wcs.pixel_to_world(717 * u.pixel, 719 * u.pixel)
aia_map.draw_quadrangle(bottom_left, axes=ax, top_right=top_right, edgecolor="red")

plt.show()
(Source code, png, hires.png, pdf)