Note
Go to the end to download the full example code.
Rotating HMI maps so they’re not ‘upside-down’#
This example shows how to rotate a HMI magnetogram, so when you plot it it appears with solar North pointing up.
import matplotlib.pyplot as plt

import sunpy.map
from sunpy.data.sample import HMI_LOS_IMAGE
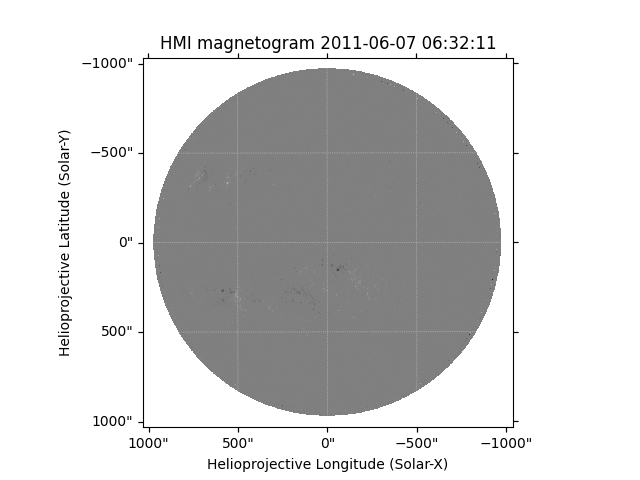
We will use the sunpy HMI sample image, load it into a map and plot it.
We see that solar North is pointed down instead of up in this image, which is
indicated by the coordinates (that range from positive to negative, rather
than negative to positive).
hmi_map = sunpy.map.Map(HMI_LOS_IMAGE)
fig = plt.figure()
ax = fig.add_subplot(projection=hmi_map)
hmi_map.plot(axes=ax)

plt.show()
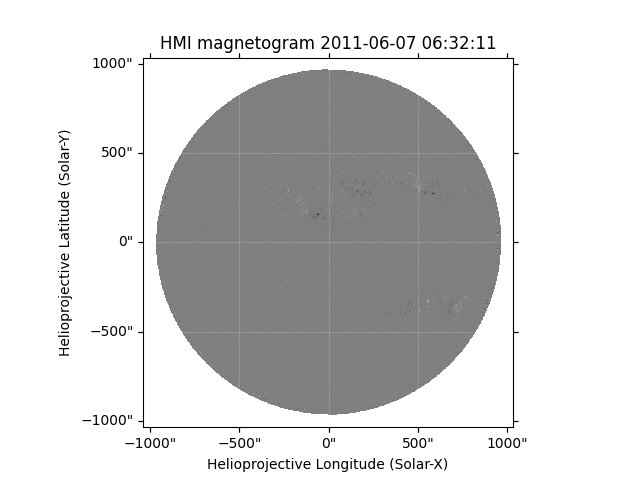
Now rotate the image such that solar North is pointed up.
We have to do this because the HMI instrument is mounted upside-down
relative to the AIA instrument on the SDO satellite, which means most
of the images are taken with solar North pointed down.
The roll angle of the instrument is reported in the FITS header
keyword CROTA2 (see Figure 17 of Couvidat et al. [2016]
which states that “the nominal CROTA2 for HMI is ≈179.93”).
The order keyword, below, specifies the type of interpolation; in this case, 3 refers to bi-cubic.
hmi_rotated = hmi_map.rotate(order=3)
fig = plt.figure()
ax = fig.add_subplot(projection=hmi_rotated)
hmi_rotated.plot(axes=ax)

plt.show()
Total running time of the script: (0 minutes 0.469 seconds)