
What’s New in sunpy 7.0?#
The SunPy Project is pleased to announce the 7.0 release of the sunpy core package.
On this page, you can read about some of the big changes in this release.
sunpy 7.0 also includes a large number of smaller improvements and bug fixes, which are described in the Full Changelog.
515 commits have been added since 6.1
23 issues have been closed since 6.1
63 pull requests have been merged since 6.1
26 people have contributed since 6.1
8 of which are new contributors
The people who have contributed to the code for this release are:
Ahmed Hossam
Albert Y. Shih
Ankit Khushwaha
Aritra Sinha
Brett J Graham
Chris Lowder *
Chris R. Gilly
David Pérez-Suárez
David Stansby
Diya Khetarpal
FreyaJain *
Hardik *
Laura Hayes
Manish Tiwari *
Mingyu Jeon *
Nabil Freij
Ole Streicher
Pratham Hole
Prisha Sharma *
Rahul Gopalakrishnan *
Saurav Kumar Roy
Shane Maloney
Stuart J. Mumford
Tanish Yelgoe
Will Barnes
_Gagan *
Where a * indicates that this release contains their first contribution to sunpy.
Updates to minimum dependencies#
The minimum required versions of the following packages have been updated:
python>=3.11
astropy>=6.1
numpy>=1.25.0
parfive>=2.1.0
packaging>=23.2
requests>=2.32.0
fsspec>=2023.6.0
asdf>=3.0.0
scipy>=1.11.0
glymur>=0.13.0
contourpy>=1.1.0
matplotlib>=3.8.0
mpl-animators>=1.2.0
reproject>=0.12.0
scipy>=1.11.0
opencv-python>=4.8.0.74
beautifulsoup4>=4.13.0
python-dateutil>=2.9.0
tqdm>=4.66.0
zeep>=4.3.0
scikit-image>=0.21.0
spiceypy>=6.0.0
h5netcdf>=1.2.0
h5py>=3.9.0
pandas>=2.1.0
aiobotocore>=2.6.0
Added support for new observatories#
There is now support for Polarimeter to Unify the Corona and Heliosphere (PUNCH) level 3 products within sunpy.

As well as for the Solar Ultraviolet Imaging Telescope (SUIT) onboard the Aditya-L1 mission.

Broadened support for existing observatories#
Added support for the latest level 1 files for SOHO’s Extreme ultraviolet Imaging Telescope (EIT). Additionally, support for the Global Oscillation Network Group (GONG) magnetogram files.
Maps now plot with auto-alignment by default#
The “auto-alignment” functionality of the Map method plot() has been significantly enhanced and is now enabled by default.
This functionality draws the map’s pixels in a coordinate-aware fashion when plotting the map on coordinate axes that may be in a different projection or even a different coordinate frame.
The previously available mesh-based approach (autoalign='mesh') draws each map pixel individually, and has been sped up dramatically.
The newly available image-based approach (autoalign='image') draws a warped version of the map as a single image, which is usually faster than the image-based approach, but has some limitations.
The default setting (autoalign=True) makes an automatic determination of whether to use the mesh-based approach or the image-based approach.
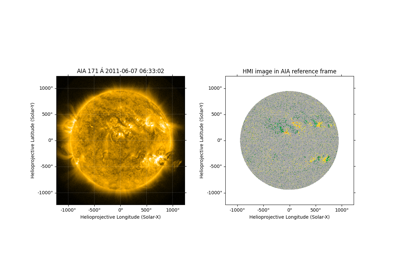
This auto-alignment functionality is for visualization purposes.
For other data-analysis needs, such as co-adding images, reprojecting the map using reproject_to() may be more appropriate.
Automatic determination of extent for reprojections#
You can now enable the automatic determination of extent for reprojections through the keyword auto_extent for the Map method reproject_to().

Using a screen with differential rotation#
When working with off-disk 2D coordinates, applying a screen assumption (PlanarScreen() or SphericalScreen()) is now fully compatible with applying differential rotation (propagate_with_solar_surface()).
Most usefully, off-disk data will be preserved when reprojecting a map.
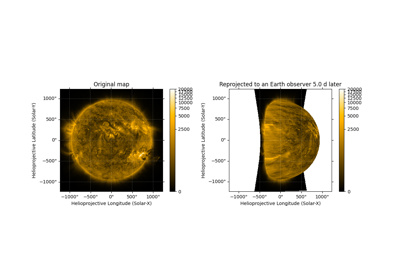
As a note of caution, drawing gridlines on the differentially rotated screen can take a lot of computing time.
Access to the JSOC AIA “synoptic” data#
It is now possible to download the “synoptic” AIA data from the JSOC. This dataset is not synoptic like HMI and MDI Synoptic images which are images of the solar surface reconstructed from many observations over a solar rotation but rather a synopsis of AIA data. The AIA synoptic data are calibrated Level 1.5 images with reduced 1k x 1k resolution at regular 2-minute cadence. This is not a DRMS series, it is served by a HTTPS server. It supports filtering by a single wavelength or sample rate.
>>> from sunpy.net import Fido, attrs as a
>>> results = Fido.search(a.Time("2016/1/1", "2016/1/1 00:01:00"),
...                       a.Instrument.aia, a.Level("1.5s"))
>>> results
<sunpy.net.fido_factory.UnifiedResponse object at ...>
Results from 1 Provider:

9 Results from the AIASynopsisClient:
Source: https://jsoc1.stanford.edu/data/aia/synoptic/

       Start Time               End Time        Instrument  Physobs  Source Provider Level Wavelength
----------------------- ----------------------- ---------- --------- ------ -------- ----- ----------
2016-01-01 00:00:00.000 2016-01-01 00:00:59.999        AIA intensity    SDO     JSOC  1.5S         94
2016-01-01 00:00:00.000 2016-01-01 00:00:59.999        AIA intensity    SDO     JSOC  1.5S        131
2016-01-01 00:00:00.000 2016-01-01 00:00:59.999        AIA intensity    SDO     JSOC  1.5S        171
2016-01-01 00:00:00.000 2016-01-01 00:00:59.999        AIA intensity    SDO     JSOC  1.5S        193
2016-01-01 00:00:00.000 2016-01-01 00:00:59.999        AIA intensity    SDO     JSOC  1.5S        211
2016-01-01 00:00:00.000 2016-01-01 00:00:59.999        AIA intensity    SDO     JSOC  1.5S        304
2016-01-01 00:00:00.000 2016-01-01 00:00:59.999        AIA intensity    SDO     JSOC  1.5S        335
2016-01-01 00:00:00.000 2016-01-01 00:00:59.999        AIA intensity    SDO     JSOC  1.5S       1600
2016-01-01 00:00:00.000 2016-01-01 00:00:59.999        AIA intensity    SDO     JSOC  1.5S       4500
Improved return types from the HEKClient#
The HEKClient now returns Quantity, Time, and SkyCoord objects wherever possible.
This allows for easier interpretation of results from the Heliophysics Event Knowledgebase, particularly when it comes to coordinates and bounding boxes.
Users should be aware that some redundant columns are now dropped from the results table (e.g. those columns which only contained unit information).
The original, unparsed response from the HEK can be accessed via the raw property on HEKTable.