NoRHTimeSeries#
- class sunpy.timeseries.sources.NoRHTimeSeries(data, header, units, **kwargs)[source]#
Bases:
GenericTimeSeriesNobeyama Radioheliograph Correlation lightcurve TimeSeries.
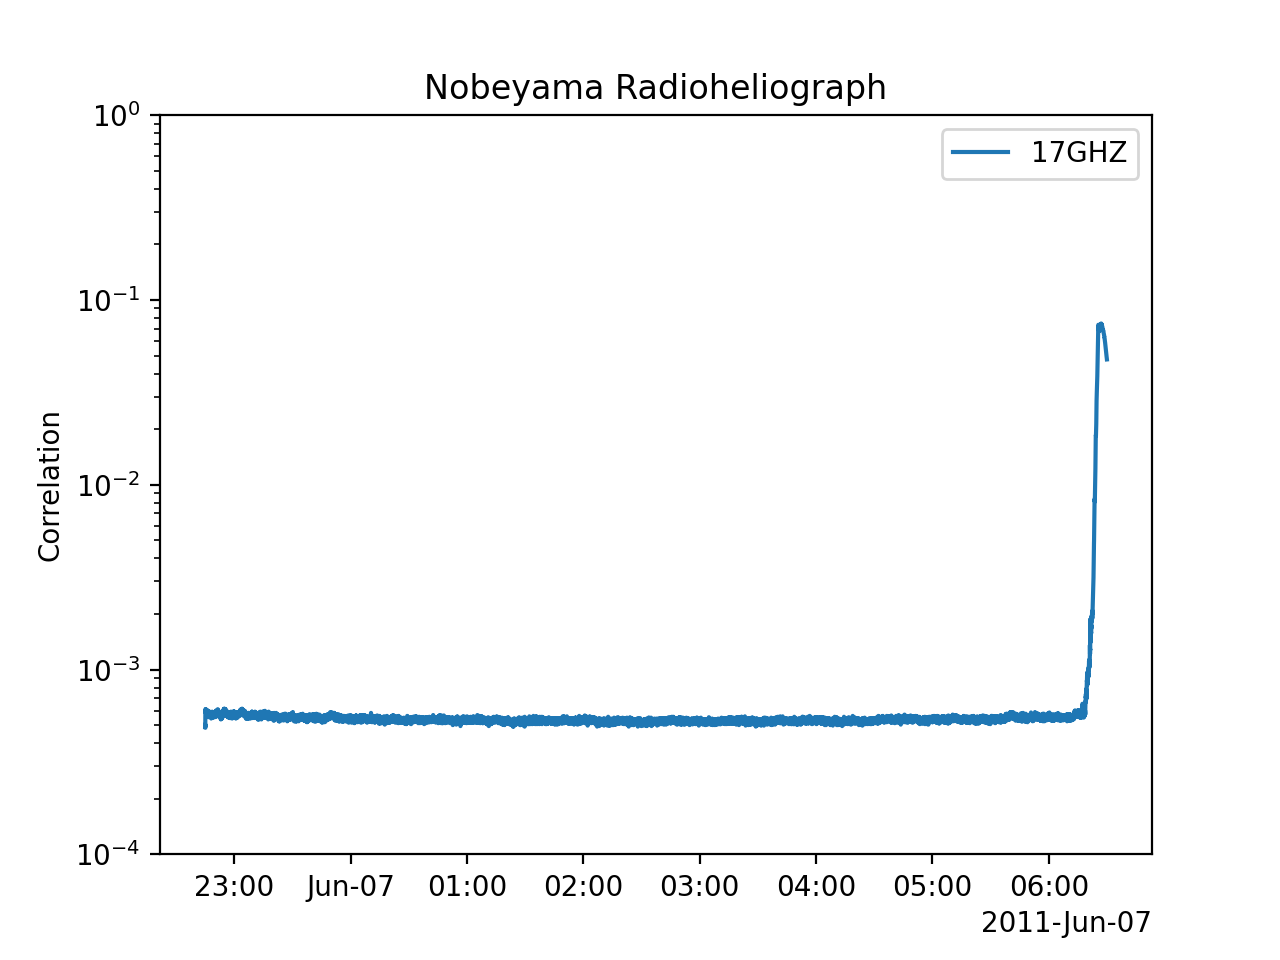
Nobeyama Radioheliograph (NoRH) is a radio telescope dedicated to observing the Sun. It consists of 84 parabolic antennas with a 80 cm diameter, sitting on lines of 490 m long in the east/west and of 220 m long in the north/south. It observes the full solar disk at 17 GHz and 34 GHz with a temporal resolution down to 0.1 second resolution (typically 1 second).
Its first observation was in April, 1992 and daily 8-hour observations are available starting June, 1992.
Examples
>>> import sunpy.data.sample
>>> import sunpy.timeseries
>>> norh = sunpy.timeseries.TimeSeries(sunpy.data.sample.NORH_TIMESERIES, source='NoRH')
>>> norh.peek()
References
Methods Summary
is_datasource_for(**kwargs)Determines if header corresponds to a Nobeyama Radioheliograph Correlation
TimeSeries.peek(*[, title, columns])Displays the NoRH lightcurve TimeSeries by calling
plot.plot([axes, columns])Plot the NoRH lightcurve.
Methods Documentation
- classmethod is_datasource_for(**kwargs)[source]#
Determines if header corresponds to a Nobeyama Radioheliograph Correlation
TimeSeries.
- peek(*, title='Nobeyama Radioheliograph', columns=None, **kwargs)[source]#
Displays the NoRH lightcurve TimeSeries by calling
plot.(
Source code,png,hires.png,pdf)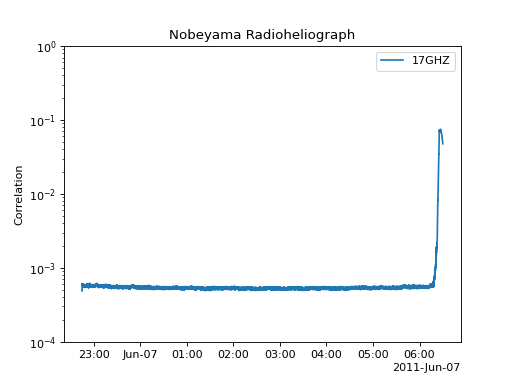
- plot(axes=None, columns=None, **kwargs)[source]#
Plot the NoRH lightcurve.
- Parameters:
axes (
matplotlib.axes.Axes, optional) – The axes on which to plot the TimeSeries. Defaults to current axes.columns (list[str], optional) – Unused, but there to maintain uniformity among plot methods.
**kwargs (
dict) – Additional plot keyword arguments that are handed toplotfunctions.
- Returns:
Axes– The plot axes.