Note
Go to the end to download the full example code.
Reprojecting to a Map Projection with a Custom Origin#
In this example, we show how to reproject a map to a map projection with a custom origin. Here, we choose the target map projection to be the azimuthal equidistant projection, also known as the Postel projection, which has useful properties relative to a specified origin of the projection. If a different map projection is desired, modifying this example is straightforward.
import matplotlib.pyplot as plt

import astropy.units as u
from astropy.coordinates import SkyCoord

import sunpy.map
from sunpy.data.sample import AIA_171_IMAGE
We will use one of the AIA images from the sample data. We fix the range of values for the Map’s normalizer for a prettier image.
aia_map = sunpy.map.Map(AIA_171_IMAGE)
aia_map.plot_settings['norm'].vmin = 0
aia_map.plot_settings['norm'].vmax = 10000
Next, we create a SkyCoord to define the custom origin
of the map projection. Here, we are going to center the projection at the
helioprojective coordinates of a particular active region. We want our map
projection to be in heliographic Stonyhurst coordinates, so we transform the
origin coordinate accordingly.
origin_hpc = SkyCoord(735*u.arcsec, -340*u.arcsec, frame=aia_map.coordinate_frame)
origin = origin_hpc.heliographic_stonyhurst
We then create a FITS-WCS header that includes our custom origin coordinate.
The azimuthal equidistant projection is specified by the code "ARC".
See Supported projections for the projection codes for
other projections.
We reproject the map to our FITS-WCS header and copy over the plot settings.
out_map = aia_map.reproject_to(out_header)
out_map.plot_settings = aia_map.plot_settings
Finally, we plot both the original and reprojected maps side by side.
fig = plt.figure(figsize=(8, 4))
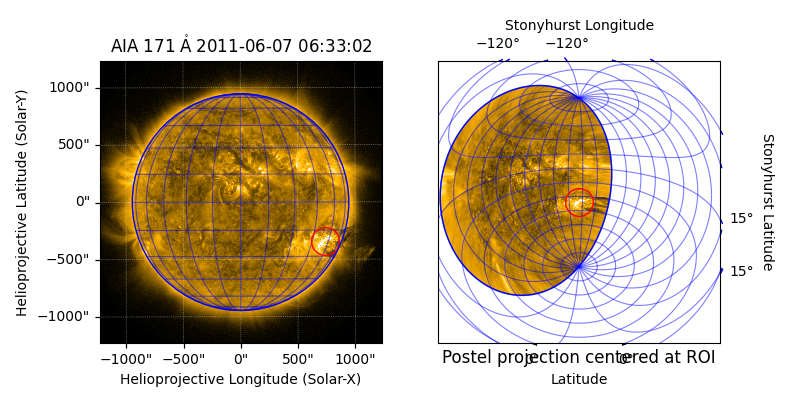
Plot the original AIA map, with the active region circled in red and the heliographic grid and solar limb in blue.
ax = fig.add_subplot(1, 2, 1, projection=aia_map)
aia_map.plot(axes=ax)
aia_map.draw_grid(axes=ax, color='blue')
aia_map.draw_limb(axes=ax, color='blue')
ax.plot_coord(origin, 'o', color='red', fillstyle='none', markersize=20)
[<matplotlib.lines.Line2D object at 0x7d02a5012710>]
Plot the reprojected AIA map, again with the active region circled in red and the heliographic grid and solar limb in blue.
ax = fig.add_subplot(1, 2, 2, projection=out_map)
out_map.plot(axes=ax)
out_map.draw_grid(axes=ax, color='blue')
out_map.draw_limb(axes=ax, color='blue')
ax.plot_coord(origin, 'o', color='red', fillstyle='none', markersize=20)
ax.set_title('Postel projection centered at ROI', y=-0.1)
plt.show()
/home/docs/checkouts/readthedocs.org/user_builds/sunpy/conda/stable/lib/python3.13/site-packages/sunpy/map/mapbase.py:2360: SunpyMetadataWarning: Missing metadata for observer: assuming Earth-based observer.
For frame 'heliographic_stonyhurst' the following metadata is missing: hgln_obs,dsun_obs,hglt_obs
For frame 'heliographic_carrington' the following metadata is missing: crlt_obs,crln_obs,dsun_obs

  observer=self.observer_coordinate,
Total running time of the script: (0 minutes 1.016 seconds)