Note
Go to the end to download the full example code.
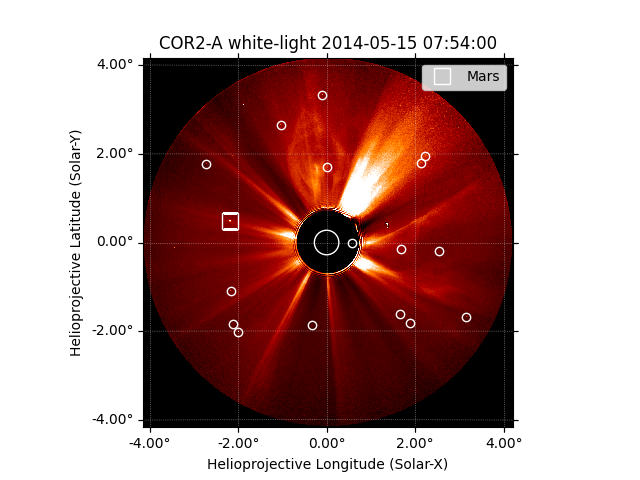
Identifying stars in a STEREO/SECCHI COR2 coronagraph image#
Since the field of view in SECCHI COR2 images can span 2 to 15 solar radii, we often observe stars in these image data. In this example, we will use the Astroquery package to query the VizieR star catalog for stars observed by the Gaia satellite within the SECCHI COR2 field of view. Then we will use the coordinates framework in SunPy and AstroPy to transform the coordinates returned by VizieR into SECCHI COR2 image coordinates. As a bonus, we’ll also identify Mars.”
This requires the installation of the astroquery
package, which can be installed on top of the existing sunpy conda
environment: conda install -c astropy astroquery and an active internet connection.
import hvpy
import matplotlib.pyplot as plt
from astroquery.gaia import Gaia

import astropy.units as u
from astropy.coordinates import Distance, Longitude, SkyCoord
from astropy.time import Time

import sunpy.map
from sunpy.coordinates import get_body_heliographic_stonyhurst
from sunpy.time import parse_time
from sunpy.util.config import get_and_create_download_dir
Maintenance with possible short-time disconnections: 29 June 2026 18:00–20:00 CEST
Let’s download a STEREO-A SECCHI COR2 image from Helioviewer.org which provide pre-processed images and load it into a Map. We download to the default sunpy download directory.
cor2_file = hvpy.save_file(hvpy.getJP2Image(parse_time('2014/05/15 07:54').datetime,
                                            hvpy.DataSource.COR2_A.value),
                           get_and_create_download_dir() + "/COR2.jp2")
cor2_map = sunpy.map.Map(cor2_file)
To efficiently search the star field, we need to know what stars are near the Sun as observed by STEREO. We need the vector that points from STEREO to the Sun. The location of STEREO in HCRS provides the Sun-to-STEREO vector.
sun_to_stereo = cor2_map.observer_coordinate.transform_to('hcrs')
We then calculate the apparent right ascension and declination of the Sun as seen from STEREO.
center_ra = Longitude(sun_to_stereo.ra + 180*u.deg).to_value(u.deg)
center_dec = -sun_to_stereo.dec.to_value(u.deg)
print(center_ra, center_dec)
210.14232004051672 -12.285221923939595
Let’s look up bright stars using the Gaia search capability provided by astroquery. We will search the Gaia DR3 star catalogue for stars with magnitude brighter than 7.5 within 4 degrees of the Sun direction.
job = Gaia.launch_job(
    "SELECT ra, dec, phot_g_mean_mag, parallax, pmra, pmdec, radial_velocity, ref_epoch "
    "FROM gaiadr3.gaia_source "
    "WHERE phot_g_mean_mag < 7.5 "
    f"AND CONTAINS(POINT('ICRS', ra, dec), CIRCLE('ICRS', {center_ra}, {center_dec}, {4})) = 1"
)
result = job.get_results()
Let’s see how many stars we’ve found.
print(len(result))
36
Now we load all stars into an array coordinate. The reference epoch for the
star positions is J2016.0, so we update these positions to the date of the
COR2 observation using astropy.coordinates.SkyCoord.apply_space_motion().
Some Gaia entries may be missing information on parallax, proper motion, or
radial velocity, so we fill those gaps with the fallback assumptions of
negligible parallax and zero velocity.
tbl_crds = SkyCoord(ra=result['ra'],
                    dec=result['dec'],
                    distance=Distance(parallax=u.Quantity(result['parallax'].filled(1e-3))),
                    pm_ra_cosdec=result['pmra'].filled(0),
                    pm_dec=result['pmdec'].filled(0),
                    radial_velocity=result['radial_velocity'].filled(0),
                    frame='icrs',
                    obstime=Time(result['ref_epoch'], format='jyear'))
tbl_crds = tbl_crds.apply_space_motion(new_obstime=cor2_map.date)
One of the bright features is actually Mars, so let’s also get that coordinate.
mars = get_body_heliographic_stonyhurst('mars', cor2_map.date, observer=cor2_map.observer_coordinate)
Let’s plot the results. The coordinates will be transformed automatically
when plotted using plot_coord().
fig = plt.figure()
ax = fig.add_subplot(projection=cor2_map)

# Let's tweak the axis to show in degrees instead of arcsec
lon, lat = ax.coords
lon.set_major_formatter('d.dd')
lat.set_major_formatter('d.dd')

cor2_map.plot(axes=ax, vmin=0, vmax=600)
cor2_map.draw_limb(axes=ax)

# Plot the position of Mars
ax.plot_coord(mars, 's', color='white', fillstyle='none', markersize=12, label='Mars')
# Plot all of the stars
ax.plot_coord(tbl_crds, 'o', color='white', fillstyle='none')
ax.legend()

plt.show()
Total running time of the script: (0 minutes 3.763 seconds)