Note
Go to the end to download the full example code.
Set Axis Range When Plotting a Map#
In this example we are going to look at how to set the axes
range using Matplotlib’s set_xlim and set_ylim when plotting a
Map with WCSAxes.
import matplotlib.pyplot as plt

import astropy.units as u
from astropy.coordinates import SkyCoord

import sunpy.data.sample
import sunpy.map
Lets start by creating a Map from the sample data.
aia_map = sunpy.map.Map(sunpy.data.sample.AIA_171_IMAGE)
Now lets say for example we are only interested in plotting a certain region
of this Map. One way this could be done is to create a submap over the region
of interest and then plotting that. Another useful way is to set the axes
range over which to plot using Matplotlib’s
set_xlim and set_ylim functionality.
The axes that Matplotlib uses is in pixel coordinates (e.g. of image data array)
rather than world coordinates (e.g. in arcsecs) so we need to define our limits that
are passed to set_xlim, set_ylim to pixel coordinates.
We can define our limits we want to use in world coordinates and then work out what pixel
coordinates these correspond to.
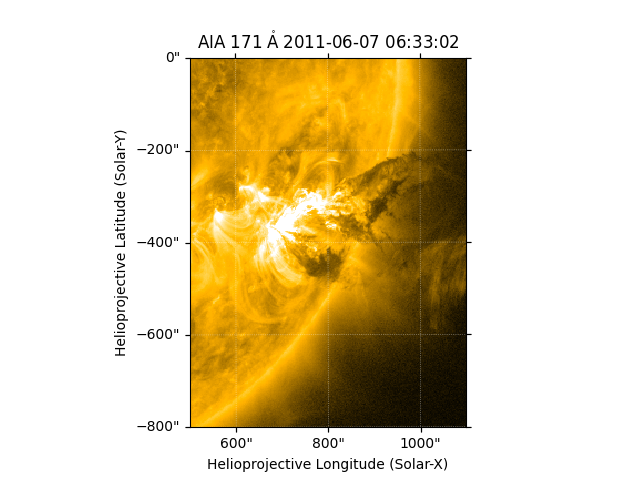
Lets choose x-limits and y-limits in arcsecs that we are interested in.
xlims_world = [500, 1100]*u.arcsec
ylims_world = [-800, 0]*u.arcsec
We can then convert these into a SkyCoord which can be passed to
GenericMap.wcs.world_to_pixel
to determine the corresponding pixel coordinates.
world_coords = SkyCoord(Tx=xlims_world, Ty=ylims_world, frame=aia_map.coordinate_frame)
pixel_coords_x, pixel_coords_y = aia_map.wcs.world_to_pixel(world_coords)
We can now plot this Map and then use pixel_coords_x and pixel_coords_y to set
the limits on the axes.
fig = plt.figure()
ax = fig.add_subplot(projection=aia_map)
aia_map.plot(axes=ax, clip_interval=(1, 99.9)*u.percent)
ax.set_xlim(pixel_coords_x)
ax.set_ylim(pixel_coords_y)

plt.show()
Total running time of the script: (0 minutes 0.228 seconds)