Note
Go to the end to download the full example code.
Differentially rotating a map#
How to apply differential rotation to a Map.
The example uses the propagate_with_solar_surface()
context manager to apply differential rotation during coordinate
transformations.
import matplotlib.pyplot as plt

import astropy.units as u
from astropy.coordinates import SkyCoord
from astropy.wcs import WCS

import sunpy.map
from sunpy.coordinates import Helioprojective, SphericalScreen, propagate_with_solar_surface
from sunpy.data.sample import AIA_171_IMAGE
First, load an AIA observation.
aiamap = sunpy.map.Map(AIA_171_IMAGE)
in_time = aiamap.date
Let’s define the output frame to be five days in the future for an observer at Earth (i.e., about five degrees offset in heliographic longitude compared to the location of AIA in the original observation).
out_time = in_time + 5*u.day
out_frame = Helioprojective(observer='earth', obstime=out_time,
                            rsun=aiamap.coordinate_frame.rsun)
Construct a WCS object for the output map. If one has an actual Map
object at the desired output time (e.g., the actual AIA observation at the
output time), one can use the WCS object from that Map object (e.g.,
mymap.wcs) instead of constructing a custom WCS.
out_center = SkyCoord(0*u.arcsec, 0*u.arcsec, frame=out_frame)
header = sunpy.map.make_fitswcs_header(aiamap.data.shape,
                                       out_center,
                                       scale=u.Quantity(aiamap.scale))
out_wcs = WCS(header)
Reproject the map from the input frame to the output frame. We use the
propagate_with_solar_surface() context manager so
that coordinates are treated as points that evolve in time with the
rotation of the solar surface rather than as inertial points in space.
with propagate_with_solar_surface():
    out_warp = aiamap.reproject_to(out_wcs)

fig = plt.figure()
ax = fig.add_subplot(projection=out_warp)
out_warp.plot(axes=ax, vmin=0, vmax=20000,
              title=f"Reprojected to an Earth observer {(out_time - in_time).to('day')} later")
<matplotlib.image.AxesImage object at 0x7d0279a47250>
Note that the off-disk parts of the map have been discarded. This is due to
the lack of knowledge of where that data should be placed in the 3D space.
Let’s reproject again, but this time apply a so-called screen (e.g.,
SphericalScreen()) to tell the coordinate framework
what assumption to use beyond the disk.
with propagate_with_solar_surface(), SphericalScreen(aiamap.observer_coordinate, only_off_disk=True):
    out_warp_with_screen = aiamap.reproject_to(out_wcs)
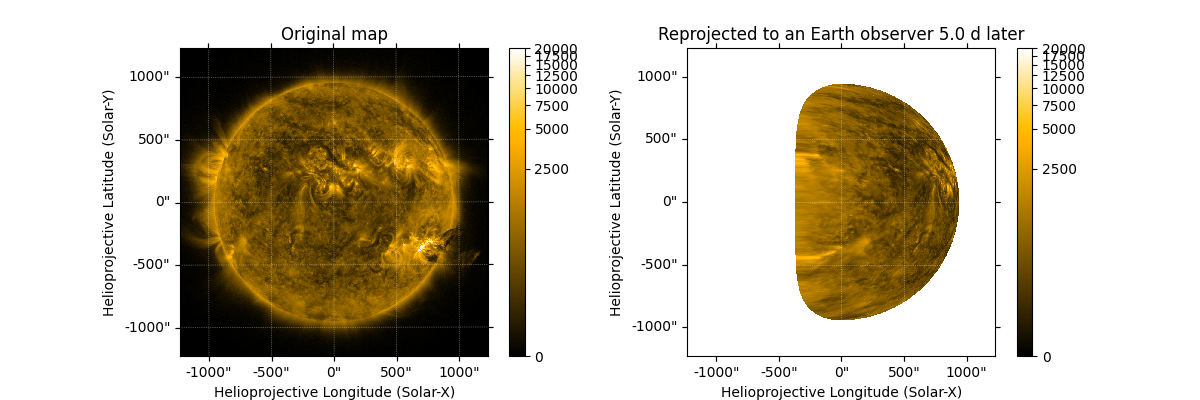
Let’s plot the differentially rotated Map next to the original Map.
fig = plt.figure(figsize=(12, 4))

ax1 = fig.add_subplot(121, projection=aiamap)
aiamap.plot(axes=ax1, vmin=0, vmax=20000, title='Original map')
plt.colorbar()

ax2 = fig.add_subplot(122, projection=out_warp_with_screen)
out_warp_with_screen.plot(axes=ax2, vmin=0, vmax=20000,
                          title=f"Reprojected to an Earth observer {(out_time - in_time).to('day')} later")
plt.colorbar()

plt.show()

Total running time of the script: (0 minutes 6.035 seconds)