Note
Go to the end to download the full example code.
Retrieving and analyzing GOES X-Ray Sensor (XRS) data#
The X-ray Sensor (XRS) on board the GOES series of satellites have provided soft X-ray measurements in two broadband energy ranges 0.5-4 and 1-8 angstrom since 1975. The GOES 16 and 17 satellites are the latest in line. The flux levels in the GOES 1-8 angstrom channel are used to report flares and determine their size (i.e. their GOES class).
In this example we are going to look at how you can query and
retrieve the GOES XRS data using Fido and load it
into a TimeSeries.
Some things to note: NOAA have recently re-processed the GOES 13, 14 and 15 XRS science quality data, such that the SWPC scaling factor has been removed. This means that the fluxes will have a different values, and so will flare peak fluxes from previous 13, 14 and 15 XRS data. See here for more details. The sunpy GOES XRS client for Fido now provides this new re-processed data. We now also provide the data for GOES 16 and 17.
Another thing to note is that the GOES XRS client Fido now
returns all available GOES data for the specific timerange queried. For
example, there are times when GOES 13, 14 and 15 overlap and such data is
available from each satellite. Similarly there are times when GOES 16 and 17 overlap.
import matplotlib.pyplot as plt
import numpy as np

from astropy.visualization import time_support

from sunpy import timeseries as ts
from sunpy.net import Fido
from sunpy.net import attrs as a
Lets first define our start and end times and query using the
Fido.
Results from 1 Provider:

6 Results from the XRSClient:
Source: <8: https://umbra.nascom.nasa.gov/goes/fits
8-15: https://www.ncei.noaa.gov/data/goes-space-environment-monitor/access/science/
16-17: https://data.ngdc.noaa.gov/platforms/solar-space-observing-satellites/goes/

       Start Time               End Time        Instrument  Physobs   Source Provider Resolution SatelliteNumber filename_res
----------------------- ----------------------- ---------- ---------- ------ -------- ---------- --------------- ------------
2015-06-21 00:00:00.000 2015-06-21 23:59:59.999        XRS irradiance   GOES     NOAA      irrad              13         gxrs
2015-06-21 00:00:00.000 2015-06-21 23:59:59.999        XRS irradiance   GOES     NOAA      avg1m              13         xrsf
2015-06-21 00:00:00.000 2015-06-21 23:59:59.999        XRS irradiance   GOES     NOAA      irrad              14         gxrs
2015-06-21 00:00:00.000 2015-06-21 23:59:59.999        XRS irradiance   GOES     NOAA      avg1m              14         xrsf
2015-06-21 00:00:00.000 2015-06-21 23:59:59.999        XRS irradiance   GOES     NOAA      irrad              15         gxrs
2015-06-21 00:00:00.000 2015-06-21 23:59:59.999        XRS irradiance   GOES     NOAA      avg1m              15         xrsf
As we can see this now returns six results, two files for each GOES
13, one for GOES 14 and one for GOES 15, which can be identified
by the SatelliteNumber column.
The GOES data provided can either be high-cadence (1s/2s/3s based on GOES satellite) or averaged over 1 minute.
This can be noted in the Resolution column, where the avg1m and flx1s attributes are the 1 minute average and the high-cadence data, respectively.
However, we probably will only want one of these files for our analysis, so we can query by the sunpy.net.attrs:
sunpy.net.dataretriever.attrs.goes.SatelliteNumber to specify what GOES satellite number we want
to use, and sunpy.net.attrs.Resolution for the resolution. Here we will use the high-cadence observations.
Results from 1 Provider:

1 Results from the XRSClient:
Source: <8: https://umbra.nascom.nasa.gov/goes/fits
8-15: https://www.ncei.noaa.gov/data/goes-space-environment-monitor/access/science/
16-17: https://data.ngdc.noaa.gov/platforms/solar-space-observing-satellites/goes/

       Start Time               End Time        Instrument  Physobs   Source Provider Resolution SatelliteNumber filename_res
----------------------- ----------------------- ---------- ---------- ------ -------- ---------- --------------- ------------
2015-06-21 00:00:00.000 2015-06-21 23:59:59.999        XRS irradiance   GOES     NOAA      irrad              15         gxrs
Now we can see that this returns just one file for the GOES 15 data.
Lets now download this data using fetch.
file_goes15 = Fido.fetch(result_goes15)
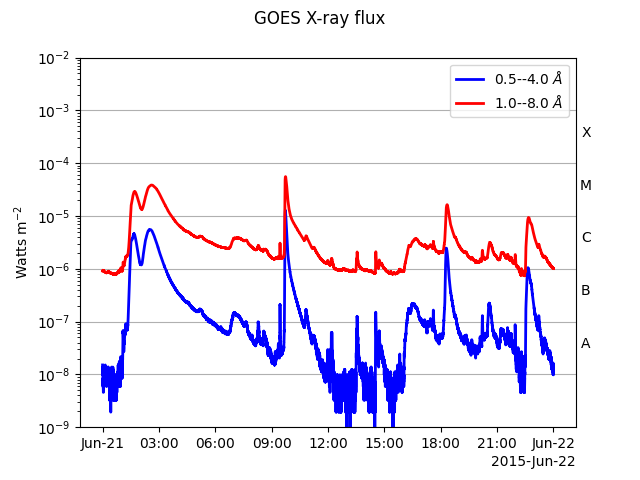
Lets now load this data into a TimeSeries,
and inspect the data using peek().
goes_15 = ts.TimeSeries(file_goes15)
goes_15.peek()
The resulting TimeSeries can be filtered by GOES quality flags. For more information
refer to the GOES Data Guide.
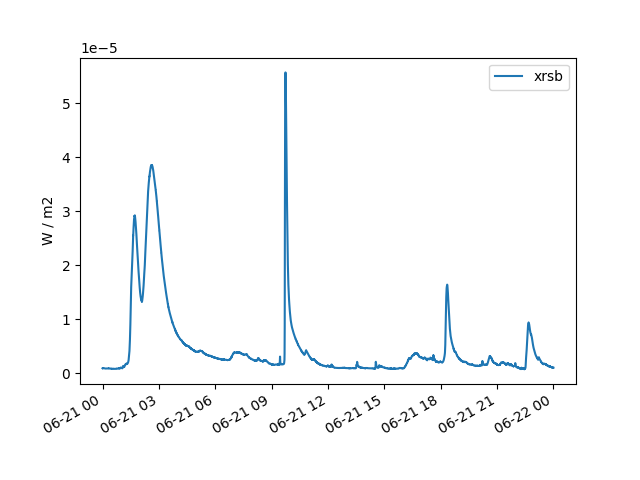
We can also pull out the individual GOES channels and plot. The 0.5-4 angstrom channel is known as the “xrsa” channel and the 1-8 angstrom channel is known as the “xrsb” channel.
fig, ax = plt.subplots()
goes_15.plot(axes=ax, columns=["xrsb"])
plt.show()
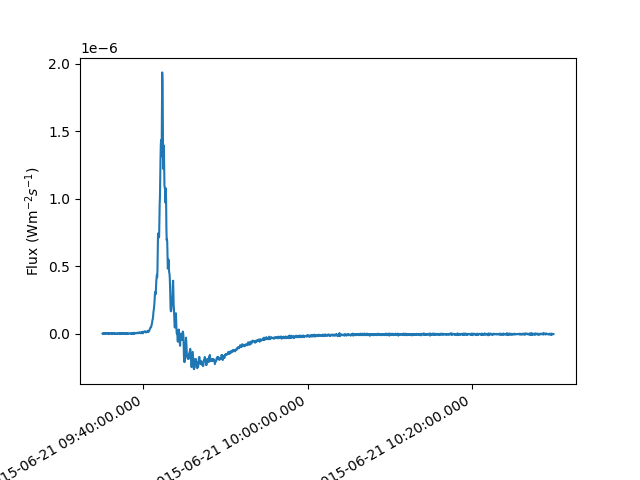
We can also truncate the data for the time of the large flare, and analyze the different channels. For example, we can plot the derivative which is useful in terms of the Neupert effect when analyzing flares.
goes_flare = goes_15.truncate("2015-06-21 09:35", "2015-06-21 10:30")

time_support()
fig, ax = plt.subplots(figsize=(10, 8))
ax.plot(goes_flare.time, np.gradient(goes_flare.quantity("xrsb")))
ax.set_ylabel("Flux (Wm$^{-2}$$s^{-1}$)")
fig.autofmt_xdate()
plt.show()
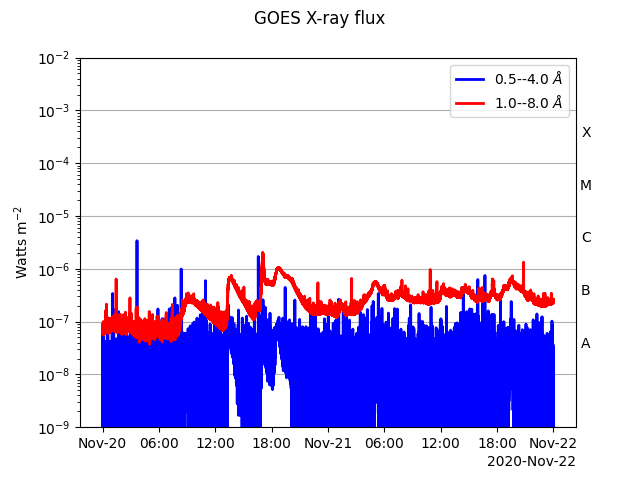
GOES 16 and 17 data#
Since March 2020, data prior to GOES 15 (incl) is no longer supported by NOAA and GOES 16 and 17 data is now provided. See here for more details. GOES 16 and 17 are part of the GOES-R series and provide XRS data at a better time resolution (1s). sunpy now supports this data also. GOES 16 has been taking observations from 2017, and GOES 17 since 2018, both of which are now and its now available through sunpy.net.Fido.
Lets query for some data over two days.
results = Fido.search(a.Time("2020-11-20 00:00", "2020-11-21 23:00"), a.Instrument("XRS"), a.Resolution("flx1s"))
print(results)
Results from 1 Provider:

4 Results from the XRSClient:
Source: <8: https://umbra.nascom.nasa.gov/goes/fits
8-15: https://www.ncei.noaa.gov/data/goes-space-environment-monitor/access/science/
16-17: https://data.ngdc.noaa.gov/platforms/solar-space-observing-satellites/goes/

       Start Time               End Time        Instrument  Physobs   Source Provider Resolution SatelliteNumber
----------------------- ----------------------- ---------- ---------- ------ -------- ---------- ---------------
2020-11-20 00:00:00.000 2020-11-20 23:59:59.999        XRS irradiance   GOES     NOAA      flx1s              16
2020-11-21 00:00:00.000 2020-11-21 23:59:59.999        XRS irradiance   GOES     NOAA      flx1s              16
2020-11-20 00:00:00.000 2020-11-20 23:59:59.999        XRS irradiance   GOES     NOAA      flx1s              17
2020-11-21 00:00:00.000 2020-11-21 23:59:59.999        XRS irradiance   GOES     NOAA      flx1s              17
We can see that we are provided with 4 results, two files for GOES 16 and two for GOES 17. Again we can make the query only specifying one GOES satellite number.
results_16 = Fido.search(a.Time("2020-11-20 00:00", "2020-11-21 23:00"), a.Instrument("XRS"),
                         a.goes.SatelliteNumber(16))
print(results_16)
Results from 1 Provider:

4 Results from the XRSClient:
Source: <8: https://umbra.nascom.nasa.gov/goes/fits
8-15: https://www.ncei.noaa.gov/data/goes-space-environment-monitor/access/science/
16-17: https://data.ngdc.noaa.gov/platforms/solar-space-observing-satellites/goes/

       Start Time               End Time        Instrument  Physobs   Source Provider Resolution SatelliteNumber
----------------------- ----------------------- ---------- ---------- ------ -------- ---------- ---------------
2020-11-20 00:00:00.000 2020-11-20 23:59:59.999        XRS irradiance   GOES     NOAA      flx1s              16
2020-11-21 00:00:00.000 2020-11-21 23:59:59.999        XRS irradiance   GOES     NOAA      flx1s              16
2020-11-20 00:00:00.000 2020-11-20 23:59:59.999        XRS irradiance   GOES     NOAA      avg1m              16
2020-11-21 00:00:00.000 2020-11-21 23:59:59.999        XRS irradiance   GOES     NOAA      avg1m              16
Lets now download this data and load into a
TimeSeries.
Total running time of the script: (0 minutes 13.546 seconds)