Note
Go to the end to download the full example code
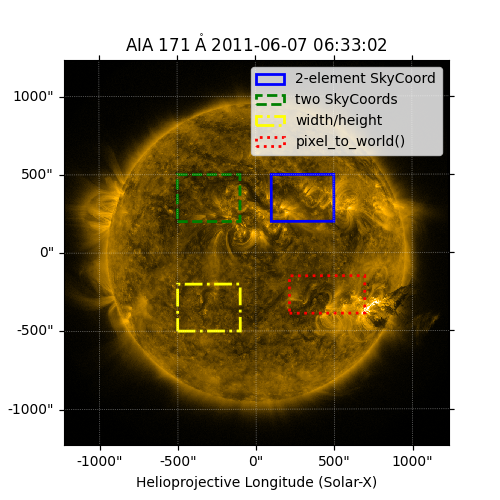
Drawing a rectangle on a map#
This example will demonstrate how to draw a rectangle on a map using draw_quadrangle().
import matplotlib.pyplot as plt

import astropy.units as u
from astropy.coordinates import SkyCoord

import sunpy.data.sample
import sunpy.map
Let’s start with a sample AIA image.
aia_map = sunpy.map.Map(sunpy.data.sample.AIA_171_IMAGE)
Here are four different ways to draw a rectangle. The first three ways
directly calls the SkyCoord class. The fourth way
converts pixel coordinates to the equivalent SkyCoord
objects using GenericMap.wcs.pixel_to_world.
fig = plt.figure(figsize=(5, 5))
ax = fig.add_subplot(projection=aia_map)
aia_map.plot(axes=ax, clip_interval=(1, 99.99)*u.percent)
<matplotlib.image.AxesImage object at 0x7fe854b64fd0>
Specify two opposite corners of the rectangle as a single, two-element SkyCoord object.
<astropy.visualization.wcsaxes.patches.Quadrangle object at 0x7fe854b660b0>
Specify two opposite corners of the rectangle as separate SkyCoord objects.
bottom_left = SkyCoord(-500 * u.arcsec, 200 * u.arcsec, frame=aia_map.coordinate_frame)
top_right = SkyCoord(-100 * u.arcsec, 500 * u.arcsec, frame=aia_map.coordinate_frame)
aia_map.draw_quadrangle(
    bottom_left,
    axes=ax,
    top_right=top_right,
    edgecolor="green",
    linestyle="--",
    linewidth=2,
    label='two SkyCoords'
)
<astropy.visualization.wcsaxes.patches.Quadrangle object at 0x7fe854b655d0>
Specify one corner of the rectangle and the rectangle’s width and height.
<astropy.visualization.wcsaxes.patches.Quadrangle object at 0x7fe854b673a0>
Draw a desired rectangle in pixel coordinates by first converting to SkyCoord objects.
bottom_left = aia_map.wcs.pixel_to_world(600 * u.pixel, 350 * u.pixel)
top_right = aia_map.wcs.pixel_to_world(800 * u.pixel, 450 * u.pixel)
aia_map.draw_quadrangle(
    bottom_left,
    axes=ax,
    top_right=top_right,
    edgecolor="red",
    linestyle=":",
    linewidth=2,
    label='pixel_to_world()'
)
ax.legend()

plt.show()
Total running time of the script: (0 minutes 0.746 seconds)