Note
Go to the end to download the full example code.
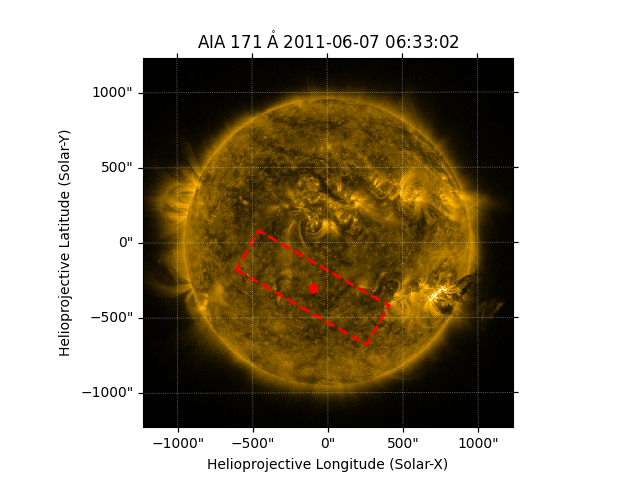
Drawing a rotated rectangle on a map#
This example will demonstrate how to draw a rectangle that is rotated relative
to the axes on a map using draw_quadrangle().
import matplotlib.pyplot as plt

import astropy.units as u
from astropy.coordinates import SkyCoord, SkyOffsetFrame

import sunpy.data.sample
import sunpy.map
Let’s start with a sample image of AIA 171.
aia_map = sunpy.map.Map(sunpy.data.sample.AIA_171_IMAGE)
Define the rotation angle and center coordinate of the rectangle, as well as the width and height in physical units.
rotation_angle = 30 * u.deg
center_coord = SkyCoord(-100 * u.arcsec, -300 * u.arcsec, frame=aia_map.coordinate_frame)
width = 1000 * u.arcsec
height = 300 * u.arcsec
We define a custom coordinate frame for the rotated rectangle by providing
the center in the AIA 171 coordinate frame and rotation angle to
SkyOffsetFrame. We then define a 2-element
SkyCoord in that custom coordinate frame for the
bottom-left and top-right corners of the rectangle.
offset_frame = SkyOffsetFrame(origin=center_coord, rotation=rotation_angle)
rectangle = SkyCoord(lon=[-1/2, 1/2] * width, lat=[-1/2, 1/2] * height, frame=offset_frame)
Finally, we will draw the rotated rectangle and its center.
fig = plt.figure()
ax = fig.add_subplot(projection=aia_map)
aia_map.plot(axes=ax, clip_interval=(1, 99.99) * u.percent)
ax.plot_coord(center_coord, "o", color="red")

aia_map.draw_quadrangle(
    rectangle,
    axes=ax,
    edgecolor="red",
    linestyle="--",
    linewidth=2,
)

plt.show()
Total running time of the script: (0 minutes 0.262 seconds)