Note
Go to the end to download the full example code.
Getting the observer location from a Map#
How to access the observer location from a Map and interpret it.
import matplotlib.pyplot as plt
import numpy as np

from astropy.constants import R_earth

import sunpy.map
from sunpy.coordinates import get_body_heliographic_stonyhurst
from sunpy.data.sample import AIA_171_IMAGE
We use the sunpy sample data.
aiamap = sunpy.map.Map(AIA_171_IMAGE)
You can access the observer coordinate with:
print(aiamap.observer_coordinate)
<SkyCoord (HeliographicStonyhurst: obstime=2011-06-07T06:33:02.880, rsun=696000.0 km): (lon, lat, radius) in (deg, deg, m)
    (-0.00406429, 0.04787238, 1.51846026e+11)>
This provides the location of the SDO as defined in the header and is necessary to fully define the helioprojective coordinate system which depends on where the observer is. Let’s see where this is with respect to Earth. SDO is a geosynchronous orbit with a semi-major axis of 42,164.71 km and an inclination of 28.05 deg. We will convert it to Geocentric Celestial Reference System (GCRS) whose center is at the Earth’s center-of-mass.
sdo_gcrs = aiamap.observer_coordinate.gcrs
sun = get_body_heliographic_stonyhurst('sun', aiamap.date)
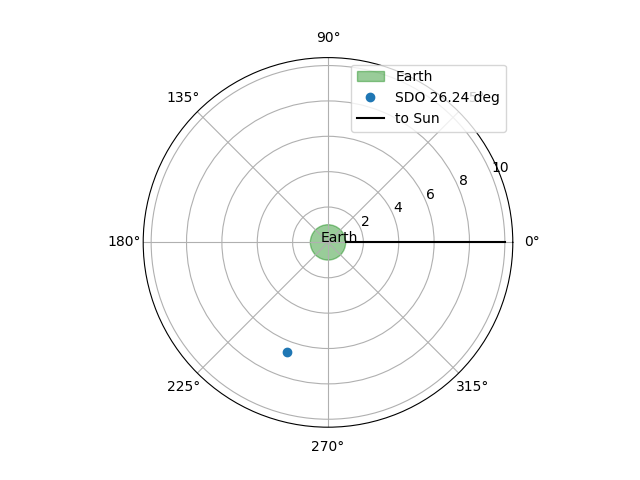
Let’s plot the results. The green circle represents the Earth. This looks like the Earth is in the way of SDO’s field of view but remember that it is also above the plane of this plot by its declination.
fig = plt.figure()
ax = fig.add_subplot(projection='polar')
circle = plt.Circle((0.0, 0.0), 1.0, transform=ax.transProjectionAffine + ax.transAxes, color="green",
                    alpha=0.4, label="Earth")
ax.add_artist(circle)
ax.text(0.48, 0.5, "Earth", transform=ax.transAxes)
ax.plot(sdo_gcrs.ra.to('rad'), sdo_gcrs.distance / R_earth, 'o', label=f'SDO {sdo_gcrs.dec:.2f}')
ax.plot(sun.lon.to('rad').value * np.ones(2), [1, 10], '-', label='to Sun', color='black')
ax.legend()

plt.show()
Total running time of the script: (0 minutes 0.131 seconds)