Note
Go to the end to download the full example code.
Plotting a map#
How to create a plot of a map.
import matplotlib.pyplot as plt

import astropy.units as u

import sunpy.map
from sunpy.data.sample import AIA_171_IMAGE
We start with the sample data.
aiamap = sunpy.map.Map(AIA_171_IMAGE)
Let’s plot the result. Setting the projection is necessary to ensure that pixels can be converted accurately to coordinates values.
fig = plt.figure()
ax = fig.add_subplot(projection=aiamap)
aiamap.plot(axes=ax)
aiamap.draw_limb(axes=ax)
aiamap.draw_grid(axes=ax)
plt.show()
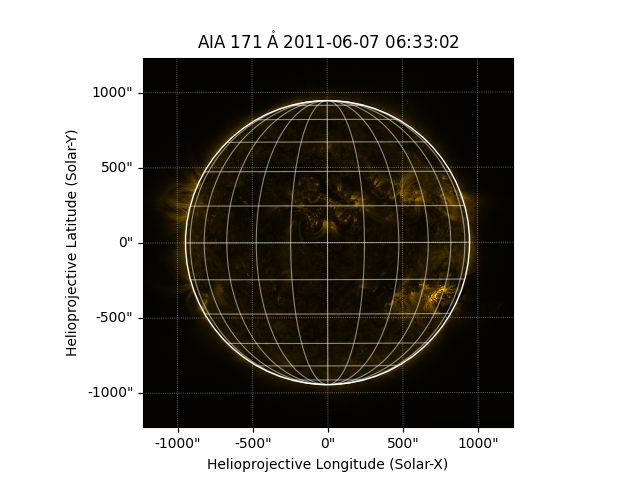
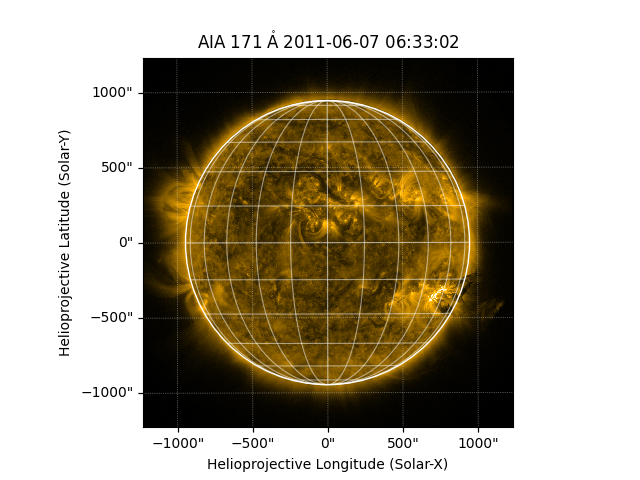
The above image looks “dark” because the color scale is accounting for the
small set of pixels that are extremely bright. We can use the keyword
clip_interval to clip out pixels with extreme values. Here, we clip out
the darkest 1% of pixels and the brightest 0.01% of pixels.
fig = plt.figure()
ax = fig.add_subplot(projection=aiamap)
aiamap.plot(axes=ax, clip_interval=(1, 99.99)*u.percent)
aiamap.draw_limb(axes=ax)
aiamap.draw_grid(axes=ax)
plt.show()
Total running time of the script: (0 minutes 0.787 seconds)