Note
Go to the end to download the full example code.
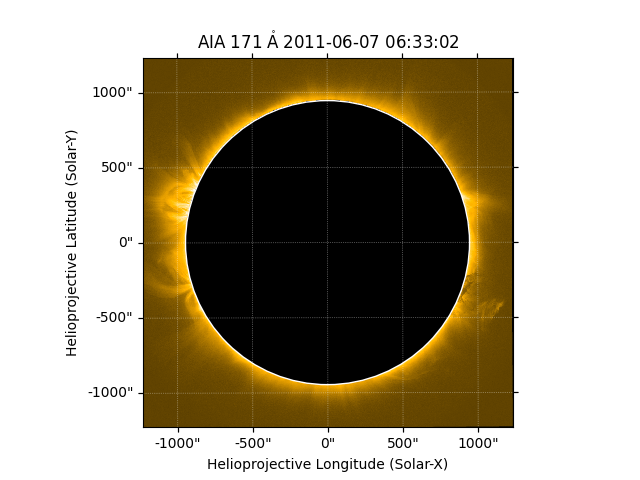
Masking out the solar disk#
How to mask out all emission from the solar disk.
import matplotlib.pyplot as plt

import sunpy.map
from sunpy.data.sample import AIA_171_IMAGE
from sunpy.map.maputils import all_coordinates_from_map, coordinate_is_on_solar_disk
We start with the sample data.
aia = sunpy.map.Map(AIA_171_IMAGE)
A utility function gives us access to the helioprojective coordinate of each pixels. We can use that to create a new array of all the coordinates that are on the solar disk.
hpc_coords = all_coordinates_from_map(aia)
Now, we can create a mask from the coordinates by using another utility
function that gives us a mask that has True for those coordinates that are
on the solar disk. We also make a slight change to the colormap so that
masked values are shown as black instead of the default white.
mask = coordinate_is_on_solar_disk(hpc_coords)
palette = aia.cmap.copy()
palette.set_bad('black')
Finally we create a new map with our new mask.
Let’s plot the results using our modified colormap.
fig = plt.figure()
ax = fig.add_subplot(projection=scaled_map)
scaled_map.plot(axes=ax, cmap=palette)
scaled_map.draw_limb(axes=ax)
plt.show()
Total running time of the script: (0 minutes 0.424 seconds)