Note
Go to the end to download the full example code.
Edge Enhancing Coronal Loops#
How to edge enhance coronal loops in an SDO/AIA image.
import matplotlib.pyplot as plt
import numpy as np
from scipy import ndimage

import astropy.units as u
from astropy.coordinates import SkyCoord

import sunpy.map
from sunpy.data.sample import AIA_171_IMAGE
We start with the sample data and crop it down to a region featuring coronal loops.
aia = sunpy.map.Map(AIA_171_IMAGE)
bottom_left = SkyCoord(750 * u.arcsec, -200 * u.arcsec, frame=aia.coordinate_frame)
top_right = SkyCoord(1500 * u.arcsec, 550 * u.arcsec, frame=aia.coordinate_frame)
aia_smap = aia.submap(bottom_left, top_right=top_right)
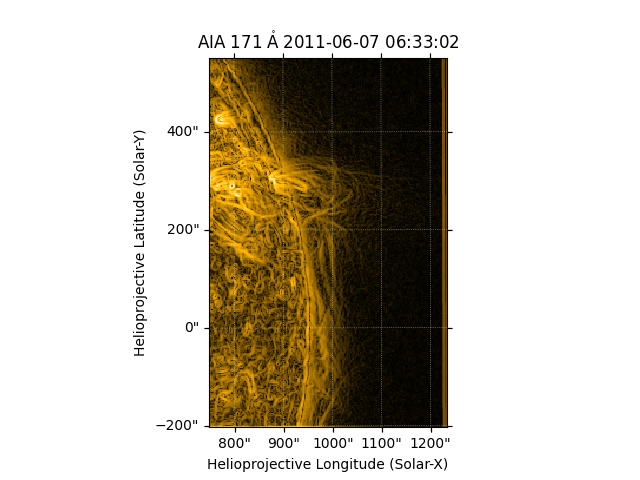
Next we apply an edge enhance filter to the data in both x and y directions and combine the two images together.
sx = ndimage.sobel(aia_smap.data, axis=0, mode='constant')
sy = ndimage.sobel(aia_smap.data, axis=1, mode='constant')
edge_enhanced_im = np.hypot(sx, sy)
Finally we create a new map with the edge enhanced data.
edge_map = sunpy.map.Map(edge_enhanced_im, aia_smap.meta)
Let’s plot the results.
fig = plt.figure()
ax = fig.add_subplot(projection=edge_map)
edge_map.plot(axes=ax)
plt.show()
Total running time of the script: (0 minutes 0.175 seconds)