Note
Go to the end to download the full example code
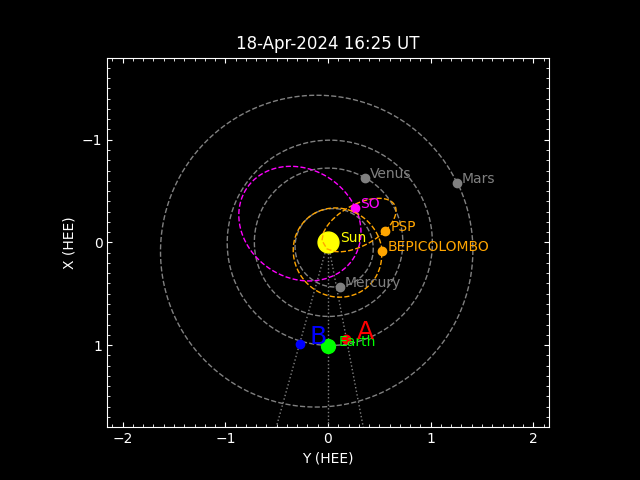
Reproducing the “Where is STEREO Today?” plot#
How to reproduce the “Where is STEREO Today?” plot.
This example uses capabilities in sunpy to reproduce the plot that can be found at https://stereo-ssc.nascom.nasa.gov/where.shtml. This example is not written as a tutorial, but there are related tutorials for learning about these capabilities:
astroquery needs to be installed.
import matplotlib as mpl
import matplotlib.pyplot as plt
import numpy as np
from matplotlib.ticker import MultipleLocator

import astropy.units as u
from astropy.coordinates import Longitude

from sunpy.coordinates import HeliocentricEarthEcliptic, get_body_heliographic_stonyhurst, get_horizons_coord
from sunpy.time import parse_time
Define the time for the plot as the time when this script is run.
obstime = parse_time('now')
Define a convenience function to extract the first full orbit from a trajectory, assuming that the trajectory moves in the direction of positive ecliptic longitude.
hee_frame = HeliocentricEarthEcliptic(obstime=obstime)


def get_first_orbit(coord):
    lon = coord.transform_to(hee_frame).spherical.lon
    shifted = Longitude(lon - lon[0])
    ends = np.flatnonzero(np.diff(shifted) < 0)
    if ends.size > 0:
        return coord[:ends[0]]
    return coord
Obtain the locations and trajectories of the various planets and spacecraft. To ensure that each trajectory contains at least one full orbit, we request 700 days for each planet and 1 year for each spacecraft.
planets = ['Mercury', 'Venus', 'Earth', 'Mars']
times = obstime + np.arange(700) * u.day
planet_coords = {planet: get_first_orbit(get_body_heliographic_stonyhurst(planet, times))
                 for planet in planets}

stereo_a = get_horizons_coord('STEREO-A', obstime)
stereo_b = get_horizons_coord('STEREO-B', obstime)

missions = ['Parker Solar Probe', 'Solar Orbiter', 'BepiColombo']
mission_labels = {'Parker Solar Probe': 'PSP', 'Solar Orbiter': 'SO', 'BepiColombo': 'BEPICOLOMBO'}
mission_coords = {mission: get_first_orbit(get_horizons_coord(mission, {'start': obstime,
                                                                        'stop': obstime + 1 * u.yr,
                                                                        'step': '1d'}))
                  for mission in missions}
INFO: Obtained JPL HORIZONS location for STEREO-A (spacecraft) (-234) [sunpy.coordinates.ephemeris]
INFO: Obtained JPL HORIZONS location for STEREO-B (spacecraft) (-235) [sunpy.coordinates.ephemeris]
INFO: Obtained JPL HORIZONS location for Parker Solar Probe (spacecraft) [sunpy.coordinates.ephemeris]
INFO: Obtained JPL HORIZONS location for Solar Orbiter (spacecraft) (-144 [sunpy.coordinates.ephemeris]
INFO: Obtained JPL HORIZONS location for BepiColombo (Spacecraft) (-121) [sunpy.coordinates.ephemeris]
Define a convenience function for converting coordinates to plot positions in the ecliptic plane.
def coord_to_heexy(coord):
    coord = coord.transform_to(hee_frame)
    coord.representation_type = 'cartesian'
    return coord.y.to_value('AU'), coord.x.to_value('AU')
Set Matplotlib settings to the desired appearance and initialize the axes.
mpl.rcParams.update({'figure.facecolor': 'black',
                     'axes.edgecolor': 'white',
                     'axes.facecolor': 'black',
                     'axes.labelcolor': 'white',
                     'axes.titlecolor': 'white',
                     'lines.linewidth': 1,
                     'xtick.color': 'white',
                     'xtick.direction': 'in',
                     'xtick.top': True,
                     'ytick.color': 'white',
                     'ytick.direction': 'in',
                     'ytick.right': True})

fig = plt.figure()
ax = fig.add_subplot()

ax.set_xlim(-2.15, 2.15)
ax.set_xlabel('Y (HEE)')
ax.xaxis.set_major_locator(MultipleLocator(1))
ax.xaxis.set_minor_locator(MultipleLocator(0.1))

ax.set_ylim(1.8, -1.8)
ax.set_ylabel('X (HEE)')
ax.yaxis.set_major_locator(MultipleLocator(1))
ax.yaxis.set_minor_locator(MultipleLocator(0.1))

ax.set_title(obstime.strftime('%d-%b-%Y %H:%M UT'))
ax.set_aspect('equal')
Draw the Sun-Earth line.
[<matplotlib.lines.Line2D object at 0x7fe854cd8af0>]
Draw Mercury, Venus, Earth, and Mars, with Earth formatted differently.
for planet, coord in planet_coords.items():
    ax.plot(*coord_to_heexy(coord), linestyle='dashed', color='gray')

    if planet == 'Earth':
        color, markersize, offset = 'lime', 10, 0.1
    else:
        color, markersize, offset = 'gray', None, 0.05

    x, y = coord_to_heexy(coord[0])
    ax.plot(x, y, 'o', markersize=markersize, color=color)
    ax.text(x + offset, y, planet, color=color)
Draw the STEREO spacecraft (without orbits), as well as Sun-STEREO lines.
Draw the Sun, which is at the origin by definition.
Text(0.12, 0, 'Sun')
Finally, draw the various spacecraft, with Solar Orbiter colored differently.
for mission, coord in mission_coords.items():
    color = 'magenta' if mission == 'Solar Orbiter' else 'orange'

    ax.plot(*coord_to_heexy(coord), linestyle='dashed', color=color)

    x, y = coord_to_heexy(coord[0])
    ax.plot(x, y, 'o', color=color)
    ax.text(x + 0.05, y, mission_labels[mission], color=color)

plt.show()

# This is necessary to reset the Matplotlib settings after plotting for our documentation.
# You don't need this in your own code.
mpl.rcParams.update(mpl.rcParamsDefault)
mpl.rcParams.update({'axes.titlecolor': 'black'})

Total running time of the script: (0 minutes 5.458 seconds)