Note
Go to the end to download the full example code
Overplotting the position of the Venus transit#
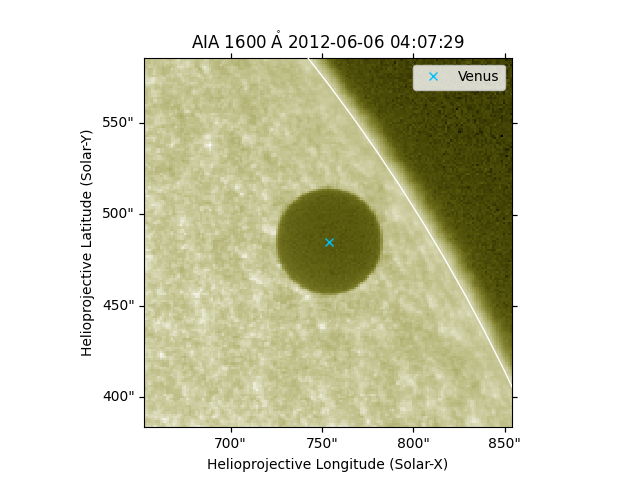
How to accurately plot the position of Venus as it transited in front of the Sun as observed by SDO/AIA.
import matplotlib.pyplot as plt

import astropy.units as u
from astropy.coordinates import SkyCoord, solar_system_ephemeris

import sunpy.map
from sunpy.coordinates import get_body_heliographic_stonyhurst
from sunpy.data.sample import AIA_1600_VENUS_IMAGE
Let’s use the sunpy sample data which has an image of the Venus transit.
aiamap = sunpy.map.Map(AIA_1600_VENUS_IMAGE)
For this example, we require high-precision ephemeris information. The built-in
ephemeris provided by astropy is not accurate enough. This call requires jplephem
to be installed. This will also trigger a download of about ~10 MB.
solar_system_ephemeris.set('de432s')
<ScienceState solar_system_ephemeris: 'de432s'>
Now we get the position of Venus and convert it into the SDO/AIA coordinates. The apparent position of Venus accounts for the time it takes for light to travel from Venus to SDO.
venus = get_body_heliographic_stonyhurst('venus', aiamap.date, observer=aiamap.observer_coordinate)
venus_hpc = venus.transform_to(aiamap.coordinate_frame)
INFO: Apparent body location accounts for 144.14 seconds of light travel time [sunpy.coordinates.ephemeris]
Let’s crop the image with Venus at its center.
fov = 200 * u.arcsec
bottom_left = SkyCoord(venus_hpc.Tx - fov/2, venus_hpc.Ty - fov/2, frame=aiamap.coordinate_frame)
smap = aiamap.submap(bottom_left, width=fov, height=fov)
Let’s plot the results.
fig = plt.figure()
ax = fig.add_subplot(projection=smap)
smap.plot(axes=ax)
smap.draw_limb(axes=ax)
ax.grid(False)
ax.plot_coord(venus_hpc, 'x', color='deepskyblue', label='Venus')
ax.legend()

plt.show()

Total running time of the script: (0 minutes 1.717 seconds)