GBMSummaryTimeSeries#
- class sunpy.timeseries.sources.GBMSummaryTimeSeries(data, meta=None, units=None, **kwargs)[source]#
Bases:
GenericTimeSeriesFermi/GBM Summary lightcurve TimeSeries.
The Gamma-ray Burst Monitor (GBM) is an instrument on board Fermi. It is meant to detect gamma-ray bursts but also detects solar flares. It consists of 12 Sodium Iodide (NaI) scintillation detectors and 2 Bismuth Germanate (BGO) scintillation detectors. The NaI detectors cover from a few keV to about 1 MeV and provide burst triggers and locations. The BGO detectors cover the energy range from about 150 keV to about 30 MeV.
This summary lightcurve makes use of the CSPEC (daily version) data set which consists of the counts accumulated every 4.096 seconds in 128 energy channels for each of the 14 detectors.
Note that the data is re-binned from the original 128 into the following 8 pre-determined energy channels. The rebinning method treats the counts in each of the original 128 channels as all having the energy of the average energy of that channel. For example, the counts in an 14.5–15.6 keV original channel would all be accumulated into the 15–25 keV rebinned channel.
4-15 keV
15-25 keV
25-50 keV
50-100 keV
100-300 keV
300-800 keV
800-2000 keV
Examples
>>> import sunpy.timeseries
>>> import sunpy.data.sample
>>> gbm = sunpy.timeseries.TimeSeries(sunpy.data.sample.GBM_TIMESERIES, source='GBMSummary')
>>> gbm.peek()
References
Methods Summary
is_datasource_for(**kwargs)Determines if the file corresponds to a GBM summary lightcurve
TimeSeries.peek(*[, title, columns])Displays the GBM timeseries by calling
plot.plot([axes, columns])Plots the GBM timeseries.
Methods Documentation
- classmethod is_datasource_for(**kwargs)[source]#
Determines if the file corresponds to a GBM summary lightcurve
TimeSeries.
- peek(*, title=None, columns=None, **kwargs)[source]#
Displays the GBM timeseries by calling
plot.(
Source code,png,hires.png,pdf)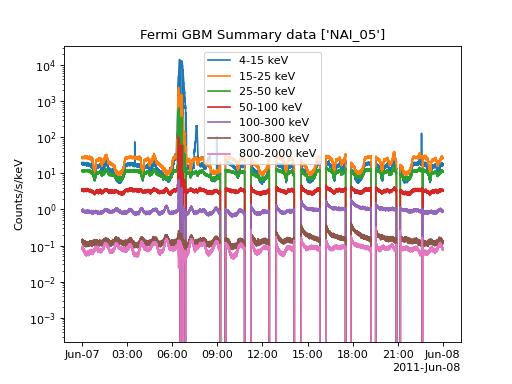
- plot(axes=None, columns=None, **kwargs)[source]#
Plots the GBM timeseries.
- Parameters:
axes (
matplotlib.axes.Axes, optional) – The axes on which to plot the TimeSeries. Defaults to current axes.columns (list[str], optional) – If provided, only plot the specified columns.
**kwargs (
dict) – Additional plot keyword arguments that are handed toplotfunctions.
- Returns:
Axes– The plot axes.