Note
Go to the end to download the full example code.
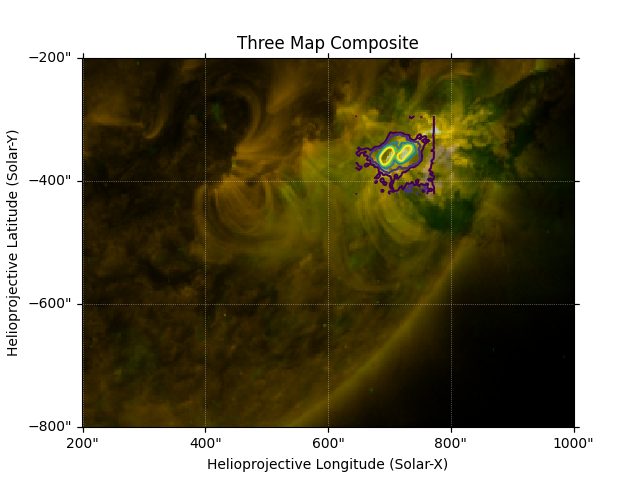
Creating a Composite Plot with Three Maps#
In this example, a composite plot is created with three maps. It demonstrates how to specify contour levels, transparency, and ordering when overlaying multiple maps.
import matplotlib.pyplot as plt

import astropy.units as u
from astropy.coordinates import SkyCoord

import sunpy.data.sample
from sunpy.coordinates import SphericalScreen
from sunpy.map import Map
First, we will import sample data from EIT, RHESSI, and AIA. The EIT data shows a hot region of the solar corona, while AIA shows the cooler upper region of the corona. RHESSI data is focused on a solar flare, and will be plotted using contours.
eit = Map(sunpy.data.sample.EIT_195_IMAGE)
rhessi = Map(sunpy.data.sample.RHESSI_IMAGE)
aia = Map(sunpy.data.sample.AIA_171_IMAGE)
Before we plot the image, let’s reproject the off-disk AIA coordinates onto a spherical screen at the same distance as the EIT map, so they can be overlaid. Next, zoom in around the solar flare so the RHESSI contours are visible. Also, specify the RHESSI contour levels to be plotted.
with SphericalScreen(eit.observer_coordinate):
    aia = aia.reproject_to(eit.wcs)

bottom_left = [200, -800] * u.arcsec
top_right = [1000, -200] * u.arcsec
eit_smap = eit.submap(SkyCoord(*bottom_left, frame=eit.coordinate_frame),
                      top_right=SkyCoord(*top_right, frame=eit.coordinate_frame))
aia_smap = aia.submap(SkyCoord(*bottom_left, frame=aia.coordinate_frame),
                      top_right=SkyCoord(*top_right, frame=aia.coordinate_frame))
levels = [5, 10, 20, 30, 40]*u.percent
/home/docs/checkouts/readthedocs.org/user_builds/sunpy/conda/stable/lib/python3.13/site-packages/sunpy/map/mapbase.py:3156: SunpyUserWarning: rsun mismatch detected: AIA 171.0 Angstrom 2011-06-07 06:33:02.rsun_meters=696000000.0 m;  2011-06-07 20:37:52.rsun_meters=696310061.3753 m. This might cause unexpected results during reprojection.
  warn_user("rsun mismatch detected: "
When creating the plot, choose which Map will be used to create the WCS Axes
that the other Maps will be plotted with. The EIT map is plotted first,
followed by the AIA map, and lastly the RHESSI contours. Transparency is
changed to 70% on the AIA map by specifying the parameter alpha, and the
image data is autoaligned to the EIT WCS Axes. The parameter zorder
specifies how each plot is layered (0 is plotted first and 1 is layered on
top of 0, and so on).
fig = plt.figure()
ax = fig.add_subplot(projection=eit_smap)
eit_smap.plot(axes=ax, clip_interval=(1, 99.9)*u.percent, zorder=0)
aia_smap.plot(axes=ax, clip_interval=(1, 99.97)*u.percent, alpha=0.7, zorder=1)
rhessi.draw_contours(axes=ax, levels=levels, zorder=2)
ax.set_title("Three Map Composite")

plt.show()
/home/docs/checkouts/readthedocs.org/user_builds/sunpy/conda/stable/lib/python3.13/site-packages/sunpy/map/mapbase.py:671: SunpyMetadataWarning: Missing metadata for observer: assuming Earth-based observer.
For frame 'heliographic_stonyhurst' the following metadata is missing: hgln_obs,dsun_obs,hglt_obs
For frame 'heliographic_carrington' the following metadata is missing: crlt_obs,crln_obs,dsun_obs

  obs_coord = self.observer_coordinate
Total running time of the script: (0 minutes 1.638 seconds)