Note
Go to the end to download the full example code.
Querying and loading SHARP data#
In this example we will demonstrate how to acquire Spaceweather HMI Active Region Patch (SHARP) data and load it into a sunpy.map.Map.
import os

import matplotlib.pyplot as plt

import astropy.units as u

import sunpy.map
from sunpy.net import Fido
from sunpy.net import attrs as a
To search for SHARP data, we will need to query the JSOC.
We will use Fido
and make use of the search attributes in sunpy.net.jsoc that allow us to query the JSOC.
Exporting data from the JSOC requires registering your email first. Please replace this with your email address once you have registered like so: jsoc_email = “your_email@example.com” See this page for more details.
jsoc_email = os.environ["JSOC_EMAIL"]

result = Fido.search(
    a.Time("2011-03-09 23:20:00", "2011-03-09 23:30:00"),
    a.Sample(1*u.hour),
    a.jsoc.Series("hmi.sharp_cea_720s"),
    a.jsoc.PrimeKey("HARPNUM", 401),
    a.jsoc.Notify(jsoc_email),
    a.jsoc.Segment("Bp"))
print(result)
Results from 1 Provider:

1 Results from the JSOCClient:
Source: http://jsoc.stanford.edu

         T_REC          TELESCOP  INSTRUME WAVELNTH CAR_ROT
----------------------- -------- --------- -------- -------
2011.03.09_23:24:00_TAI  SDO/HMI HMI_SIDE1   6173.0    2107
Next, we can download the file.
file = Fido.fetch(result)
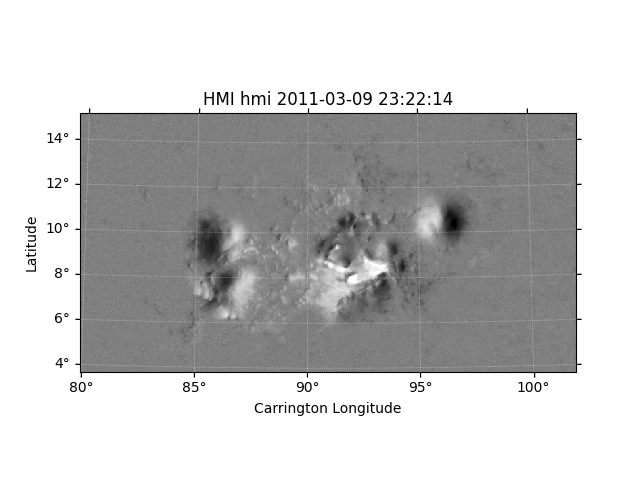
Now that we have the file, we can construct a Map and plot it.
sharp_map = sunpy.map.Map(file)
fig = plt.figure()
ax = fig.add_subplot(projection=sharp_map)
sharp_map.plot(axes=ax)

plt.show()
Total running time of the script: (0 minutes 17.389 seconds)