Note
Go to the end to download the full example code.
Using TimeSeries#
This example is intended to demonstrate the current state of TimeSeries.
import datetime
from collections import OrderedDict

import matplotlib.pyplot as plt
import numpy as np
from pandas import DataFrame

import astropy.units as u
from astropy.time import Time, TimeDelta

import sunpy.data.sample
import sunpy.timeseries
from sunpy.net import Fido
from sunpy.net import attrs as a
from sunpy.time import TimeRange, parse_time
from sunpy.util.metadata import MetaDict
We can create a range of supported timeseries:
There is a source keyword that allows one to specify the source of the data
It should be auto-detected in most cases.
ts_eve = sunpy.timeseries.TimeSeries(sunpy.data.sample.EVE_TIMESERIES, source='EVE')
ts_goes = sunpy.timeseries.TimeSeries(sunpy.data.sample.GOES_XRS_TIMESERIES, source='XRS')
ts_lyra = sunpy.timeseries.TimeSeries(sunpy.data.sample.LYRA_LEVEL3_TIMESERIES, source='LYRA')
ts_norh = sunpy.timeseries.TimeSeries(sunpy.data.sample.NORH_TIMESERIES, source='NoRH')
ts_rhessi = sunpy.timeseries.TimeSeries(sunpy.data.sample.RHESSI_TIMESERIES, source='RHESSI')
ts_gbm = sunpy.timeseries.TimeSeries(sunpy.data.sample.GBM_TIMESERIES, source='GBMSummary')
You can create a list of timeseries when using multiple files.
First, we shall download these files using Fido.
goes = Fido.search(a.Time("2012/06/01", "2012/06/04"), a.Instrument.xrs)
goes_files = Fido.fetch(goes)

# Using these new files you get a list of timeseries
list_of_goes_ts = sunpy.timeseries.TimeSeries(goes_files, source='XRS')
You can concatenate them together using concatenate
or when creating the TimeSeries
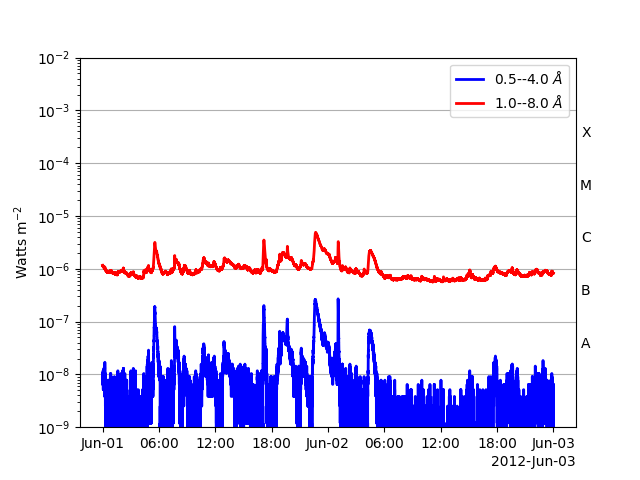
combined_goes_ts = sunpy.timeseries.TimeSeries(goes_files, source='XRS', concatenate=True)
# Manually
combined_goes_ts = list_of_goes_ts[0].concatenate(list_of_goes_ts[1])

fig, ax = plt.subplots()
combined_goes_ts.plot(axes=ax)

plt.show()
The TimeSeries object has 3 primary components:
.data : The internal data representation. If you want the underlying data,
use to_dataframe()
.meta : Stores the metadata that is able to be parsed from the data files
.units : Stores the units for each column, with keys that match the name of each column.
This will give you the metadata
ts_lyra.meta
|-------------------------------------------------------------------------------------------------|
|TimeRange                  | Columns         | Meta                                              |
|-------------------------------------------------------------------------------------------------|
|2011-06-07T00:00:00.010000 | CHANNEL1        | simple: True                                      |
|            to             | CHANNEL2        | bitpix: 8                                         |
|2011-06-07T23:59:00.010000 | CHANNEL3        | naxis: 0                                          |
|                           | CHANNEL4        | extend: True                                      |
|                           |                 | origin: ROB                                       |
|                           |                 | telescop: PROBA2                                  |
|                           |                 | instrume: LYRA                                    |
|                           |                 | object: EUV solar irrad                           |
|                           |                 | obs_mode: standard                                |
|                           |                 | date: 2015-12-16                                  |
|                           |                 | ...                                               |
|-------------------------------------------------------------------------------------------------|
This will give you the units
OrderedDict({'CHANNEL1': Unit("W / m2"), 'CHANNEL2': Unit("W / m2"), 'CHANNEL3': Unit("W / m2"), 'CHANNEL4': Unit("W / m2")})
There are a couple of other useful properties:
# The time range of the data, the name of the data columns
ts_lyra.time_range, ts_lyra.columns
(   <sunpy.time.timerange.TimeRange object at 0x7d027abcdd30>
    Start: 2011-06-07 00:00:00
    End:   2011-06-07 23:59:00
    Center:2011-06-07 11:59:30
    Duration:0.9993055555555554 days or
           23.98333333333333 hours or
           1438.9999999999998 minutes or
           86339.99999999999 seconds
, ['CHANNEL1', 'CHANNEL2', 'CHANNEL3', 'CHANNEL4'])
Further data is available from within the metadata, you can filter out for a
key using the TimeSeriesMetaData.get() method.
combined_goes_ts.meta.get("publisher_name")
|-------------------------------------------------------------------------------------------------|
|TimeRange                  | Columns         | Meta                                              |
|-------------------------------------------------------------------------------------------------|
|2012-06-01T00:00:00.111000 | xrsa            | publisher_name: National Centers for Environmental|
|            to             | xrsb            |                                                   |
|2012-06-01T23:59:58.375000 | xrsa_quality    |                                                   |
|                           | xrsb_quality    |                                                   |
|-------------------------------------------------------------------------------------------------|
|2012-06-02T00:00:00.421000 | xrsa            | publisher_name: National Centers for Environmental|
|            to             | xrsb            |                                                   |
|2012-06-02T23:59:58.685000 | xrsa_quality    |                                                   |
|                           | xrsb_quality    |                                                   |
|-------------------------------------------------------------------------------------------------|
You can access a specific value within the TimeSeries data
using all the normal pandas methods.
For example, to get the row with the index of “2015-01-01 00:02:00.008000”
Pandas will actually parse a string to a datetime automatically if it can:
lyra_data.loc['2011-06-07 00:02:00.010']
# If this fails, you will need to use parse_time to convert the string to a datetime
lyra_data.loc[parse_time('2011-06-07 00:02:00.010').datetime]
# Pandas includes methods to find the indexes of the max/min values in a dataframe:
ts_lyra.to_dataframe()['CHANNEL1'].idxmax(), ts_lyra.to_dataframe()['CHANNEL1'].idxmin()
(Timestamp('2011-06-07 03:09:00.010000'), Timestamp('2011-06-07 09:09:00.010000'))
An individual column can be extracted
ts_eve.extract('CMLon')
<sunpy.timeseries.timeseriesbase.GenericTimeSeries object at 0x7d027abbae00>
SunPy TimeSeries
----------------
Observatory:                        Unknown
Instrument:                 Unknown
Channel(s):                 CMLon
Start Date:                 2011-06-07 00:00:00
End Date:                   2011-06-07 23:59:00
Center Date:                        2011-06-07 11:59:30
Resolution:                 60.0 s
Samples per Channel:                1439
Data Range(s):              CMLon   4.13E+01
Units:                      deg
                     CMLon
Time
2011-06-07 00:00:00   12.5
2011-06-07 00:01:00   12.2
2011-06-07 00:02:00   12.5
2011-06-07 00:03:00   11.9
2011-06-07 00:04:00   14.1
...                    ...
2011-06-07 23:55:00   14.6
2011-06-07 23:56:00   15.6
2011-06-07 23:57:00   16.2
2011-06-07 23:58:00   15.8
2011-06-07 23:59:00   13.6

[1439 rows x 1 columns]
Changing the units for a column simply requires changing the value
ts_eve.units['a'] = u.m
Quantities can be extracted from a column using sunpy.timeseries.GenericTimeSeries.quantity()
<Quantity [-3.7, -3.9, -4.1, ..., -4.2, -3.9, -3.7] deg>
You can add or overwrite a column using sunpy.timeseries.GenericTimeSeries.add_column().
This method only accepts an Quantity and will convert to the intended units
if necessary.
new_quantity = quantity.value * 0.01 * ts_eve.units[colname]
new_eve_ts = ts_eve.add_column(colname, new_quantity, overwrite=True)
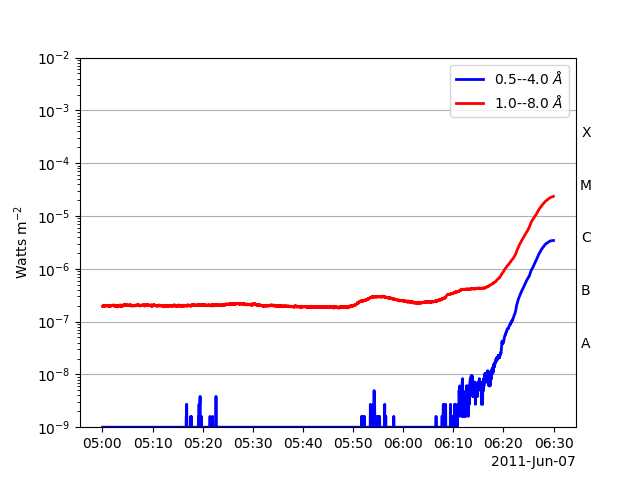
You can truncate using the sunpy.timeseries.GenericTimeSeries.truncate() method.
ts_goes_trunc = ts_goes.truncate(0, 100000, 2)
# Or using a `TimeRange`
ts_goes_trunc = ts_goes.truncate(TimeRange('2011-06-07 05:00', '2011-06-07 06:30'))
# Or using strings
ts_goes_trunc = ts_goes.truncate('2011-06-07 05:00', '2011-06-07 06:30')

fig, ax = plt.subplots()
ts_goes_trunc.plot(axes=ax)

plt.show()
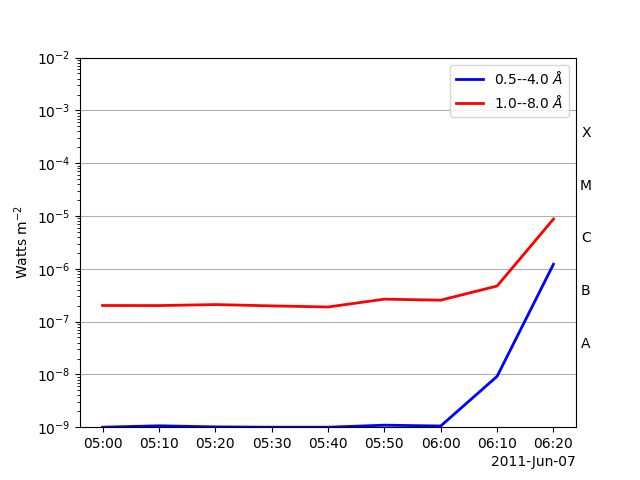
For now you can only resample by using pandas.
Changing values within the dataframe directly will often affect the units
involved, but these won’t be picked up by TimeSeries.
Take care when doing this to ensure dimensional consistency.
df_downsampled = ts_goes_trunc.to_dataframe().resample('10min').mean()
ts_downsampled = sunpy.timeseries.TimeSeries(df_downsampled,
                                             ts_goes_trunc.meta,
                                             ts_goes_trunc.units)

fig, ax = plt.subplots()
ts_downsampled.plot(axes=ax)
plt.show()
The data from the TimeSeries can be retrieved in a number of formats
# pandas DataFrame
ts_goes.to_dataframe()
# astropy Table
ts_goes.to_table()
# numpy array
ts_goes.to_array()
array([[1.0000e-09, 1.8871e-07],
       [1.0000e-09, 1.8346e-07],
       [1.0000e-09, 1.8609e-07],
       ...,
       [1.0000e-09, 1.5985e-07],
       [1.0000e-09, 1.6248e-07],
       [1.0000e-09, 1.5985e-07]], shape=(42177, 2), dtype=float32)
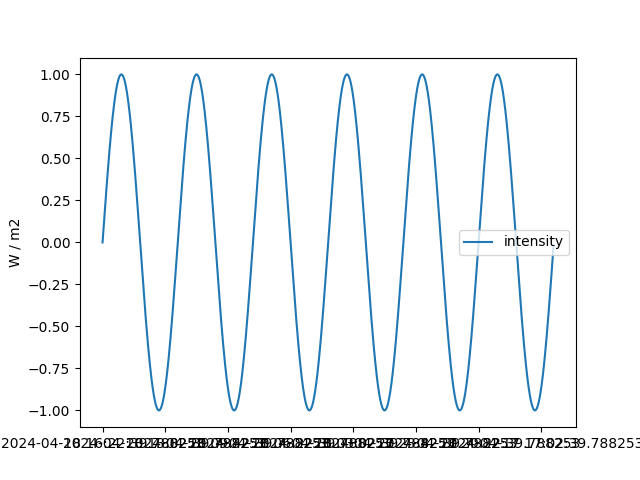
Creating a TimeSeries from scratch can be done several ways.
Input data can be in the form of a pandas.DataFrame (preferred),
an astropy.table.Table or a numpy.array.
base = datetime.datetime.today()
dates = Time(base) - TimeDelta(np.arange(24 * 60)*u.minute)
intensity = np.sin(np.arange(0, 12 * np.pi, ((12 * np.pi) / (24 * 60))))
# Create the data DataFrame, header MetaDict and units OrderedDict
data = DataFrame(intensity, index=dates, columns=['intensity'])
meta = MetaDict({'key': 'value'})
units = OrderedDict([('intensity', u.W / u.m**2)])
# Create the TimeSeries
ts_custom = sunpy.timeseries.TimeSeries(data, meta, units)

fig, ax = plt.subplots()
ts_custom.plot(axes=ax)
plt.show()
Total running time of the script: (0 minutes 10.968 seconds)