Note
Go to the end to download the full example code.
Fading between two maps#
Often it is useful to plot two maps of the Sun on top of each other, so features observed in one map (e.g. strong magnetic fields in a magnetogram) can be identified with features in the same place in another map (e.g. active regions in a EUV image).
This example shows how to plot two maps on top of each other, with a slider to fade between them.
import matplotlib.pyplot as plt
from matplotlib.widgets import Slider

import astropy.units as u

import sunpy.map
from sunpy.data.sample import AIA_171_IMAGE, AIA_1600_IMAGE
Start by loading two AIA maps from the sample data.
map_171 = sunpy.map.Map(AIA_171_IMAGE)
map_1600 = sunpy.map.Map(AIA_1600_IMAGE)
First we create a figure, and add the axes that will show the maps. Then plot both of the images on the same axes. Finally, we add another axes that contains the slider.
fig = plt.figure()
# Add the main axes. Note this is resized to leave room for the slider axes
ax = fig.add_axes([0.1, 0.2, 0.9, 0.7], projection=map_171)

im_1600 = map_1600.plot(axes=ax)
im_171 = map_171.plot(axes=ax, alpha=0.5, clip_interval=(1, 99.99)*u.percent)
ax.set_title('AIA 171 + 1600')

# Add the slider axes
ax_slider = fig.add_axes([0.25, 0.05, 0.65, 0.03])
slider = Slider(ax_slider, 'Alpha', 0, 1, valinit=0.5)
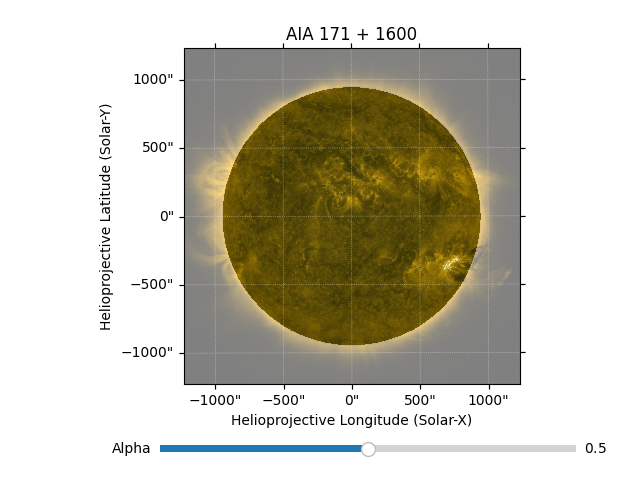
Finally, define what happens when the slider is changed and link this to the slider we set up above. In this case we just set the alpha (ie. transparency) of the 171 image.
def update(val):
    alpha = slider.val
    im_171.set_alpha(alpha)


slider.on_changed(update)

plt.show()
Total running time of the script: (0 minutes 1.616 seconds)