Note
Go to the end to download the full example code.
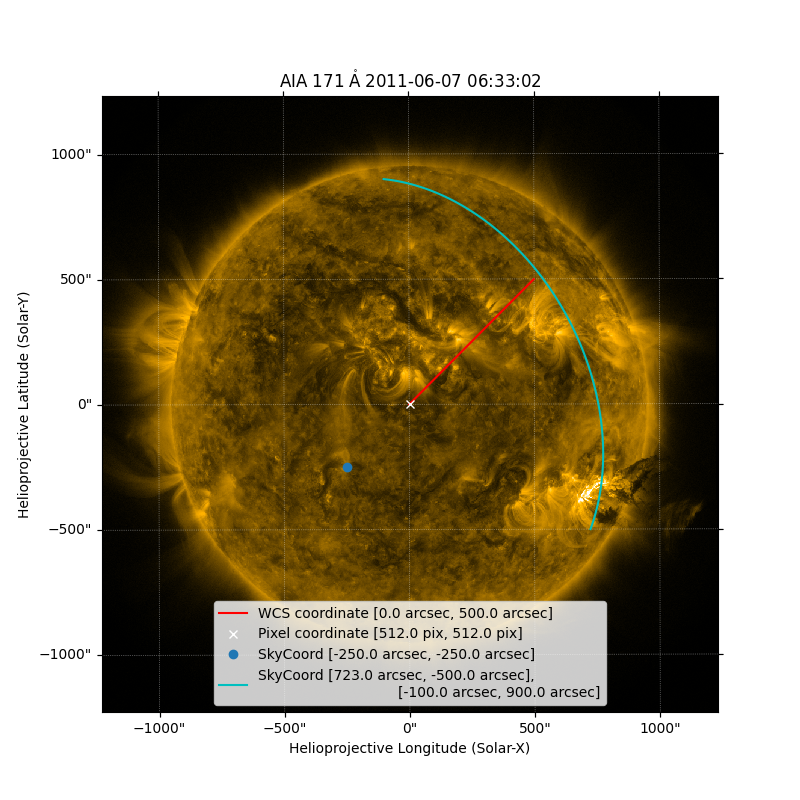
Plotting points on a Map with WCSAxes#
This example demonstrates the plotting of a point, a line and an arch in pixel coordinates, world coordinates, and SkyCoords respectively when plotting a map with WCSAxes.
import matplotlib.pyplot as plt
import numpy as np

import astropy.units as u
from astropy.coordinates import SkyCoord

import sunpy.data.sample
import sunpy.map
from sunpy.coordinates.utils import GreatArc
We will start by creating a map using an AIA 171 image. Then we shall create a standard plot of this map.
my_map = sunpy.map.Map(sunpy.data.sample.AIA_171_IMAGE)

fig = plt.figure(figsize=(8, 8))
ax = fig.add_subplot(projection=my_map)
my_map.plot(axes=ax, clip_interval=(1, 99.9)*u.percent)
<matplotlib.image.AxesImage object at 0x7d0272a23390>
Now we will plot a line on the map by using coordinates in arcseconds.
The array below xx and yy are the x and y coordinates that define a
line from the Sun center (at 0, 0) to the point (500, 500) in arcsecs.
When plotting a map a WCSAxes is created.
For plotting with WCSAxes, pixel coordinates are expected as a default, however,
we can plot world coordinates (i.e. arcsec) by using the transform keyword.
Its important to note that when transforming between world and pixel coordinates
the world coordinates need to be in degrees rather than arcsecs.
[<matplotlib.lines.Line2D object at 0x7d0272a21d10>]
Here we will plot a point in pixel coordinates (i.e. array index).
Let’s define a pixel coordinate in the middle of the image, pixel_coord.
As this coordinate is in pixel space (rather than a world coordinates like arcsec)
we do not need to use the transform keyword.
pixel_coord = [my_map.data.shape[0]/2., my_map.data.shape[1]/2.] * u.pix
ax.plot(pixel_coord[0], pixel_coord[1], 'x', color='w',
        label=f'Pixel coordinate [{pixel_coord[0]}, {pixel_coord[1]}]')
[<matplotlib.lines.Line2D object at 0x7d0272a207d0>]
As well as defining a point and using GenericMap.plot(), you can also plot
a point with WCSAxes using the plot_coord
functionality using a coordinate as a SkyCoord.
We can demonstrate this by plotting a point and an arc on a map using two separate SkyCoords.
Here we will plot a point (at -250,-250) on the map using a SkyCoord.
[<matplotlib.lines.Line2D object at 0x7d0272a22e90>]
Finally, let’s create a great arc between a start and end point defined as SkyCoords.
start = SkyCoord(723 * u.arcsec, -500 * u.arcsec, frame=my_map.coordinate_frame)
end = SkyCoord(-100 * u.arcsec, 900 * u.arcsec, frame=my_map.coordinate_frame)

great_arc = GreatArc(start, end)

my_map.plot(axes=ax, clip_interval=(1, 99.99)*u.percent)
ax.plot_coord(great_arc.coordinates(), color='c',
              label=f'SkyCoord [{723*u.arcsec}, {-500*u.arcsec}],\n \
                               [{-100*u.arcsec}, {900*u.arcsec}]')
ax.legend(loc="lower center")

plt.show()
Total running time of the script: (0 minutes 0.471 seconds)