Note
Go to the end to download the full example code.
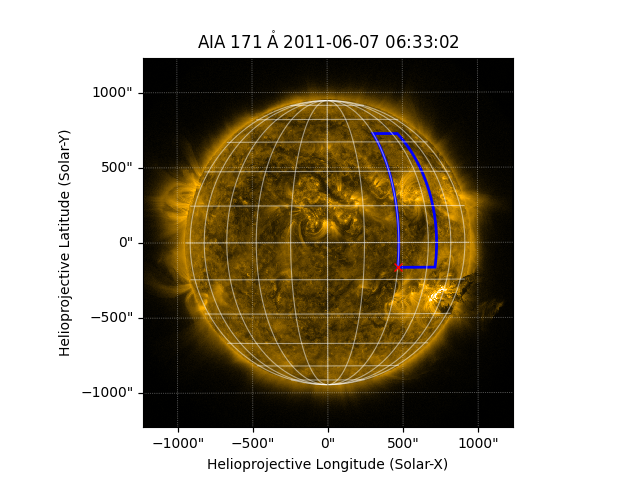
Drawing a latitude-longitude quadrangle#
How to draw a latitude-longitude quadrangle on a map.
import matplotlib.pyplot as plt

import astropy.units as u
from astropy.coordinates import SkyCoord

import sunpy.map
from sunpy.coordinates import HeliographicStonyhurst
from sunpy.data.sample import AIA_171_IMAGE
The purpose of this example is to demonstrate how to draw a quadrangle on a
map using draw_quadrangle(). A quadrangle has
edges aligned with lines of constant latitude and longitude in some
coordinate system. We start with the sample AIA image.
aia = sunpy.map.Map(AIA_171_IMAGE)
Now let’s define the bottom-left corner of the quadrangle. Note that we define it in a different coordinate frame (heliographic Stonyhurst) than the coordinate frame of the map (which is helioprojective Cartesian).
bottom_left = SkyCoord(30*u.deg, -10*u.deg,
                       frame=HeliographicStonyhurst, obstime=aia.date)
Now let’s draw a quadrangle on the map, with a width of 20 degrees and a
height of 60 degrees. Because the coordinate frame of bottom_left is
in HeliographicStonyhurst, the width and height
correspond to the longitude and latitude directions, respectively, in that
coordinate frame.
fig = plt.figure()
ax = fig.add_subplot(projection=aia)
aia.plot(axes=ax, clip_interval=(1, 99.99)*u.percent)
aia.draw_grid(axes=ax)
aia.draw_quadrangle(bottom_left, axes=ax, width=20*u.deg, height=60*u.deg,
                    edgecolor='blue', linewidth=2)
ax.plot_coord(bottom_left, 'x', color='red')

plt.show()
Total running time of the script: (0 minutes 0.458 seconds)