Note
Go to the end to download the full example code.
Editing the colormap and normalization of a Map#
How to edit the display of a map.
import matplotlib
import matplotlib.colors as colors
import matplotlib.pyplot as plt

import sunpy.map
from sunpy.data.sample import AIA_171_IMAGE
We start with the sample data.
aiamap = sunpy.map.Map(AIA_171_IMAGE)
All plot settings for a map are stored in the plot_settings attribute.
How a Map is displayed is determined by its colormap, which sets the colors
, and the normalization, which sets how data values are translated to colors.
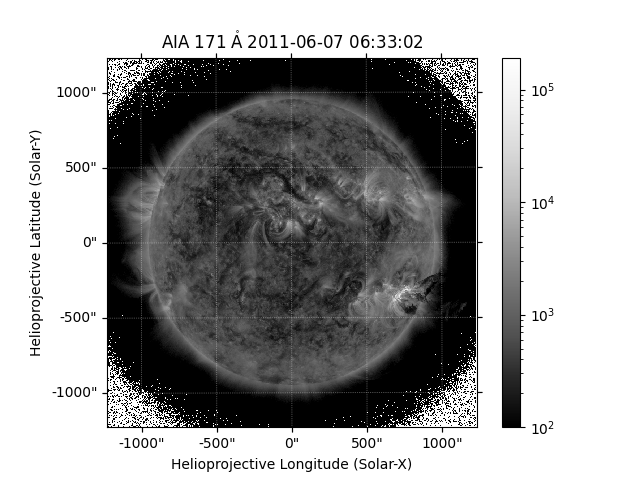
Let’s replace the colormap and normalization.
aiamap.plot_settings['cmap'] = matplotlib.colormaps['Greys_r']
aiamap.plot_settings['norm'] = colors.LogNorm(100, aiamap.max())
To see all of the colormaps sunpy provides see sunpy.visualization.colormaps.
Matplotlib provides a number of colormaps
and normalizations.
For more advanced normalizations see astropy.visualization.
fig = plt.figure()
ax = fig.add_subplot(projection=aiamap)
aiamap.plot(axes=ax)
plt.colorbar()
plt.show()
Total running time of the script: (0 minutes 0.313 seconds)