Note
Go to the end to download the full example code
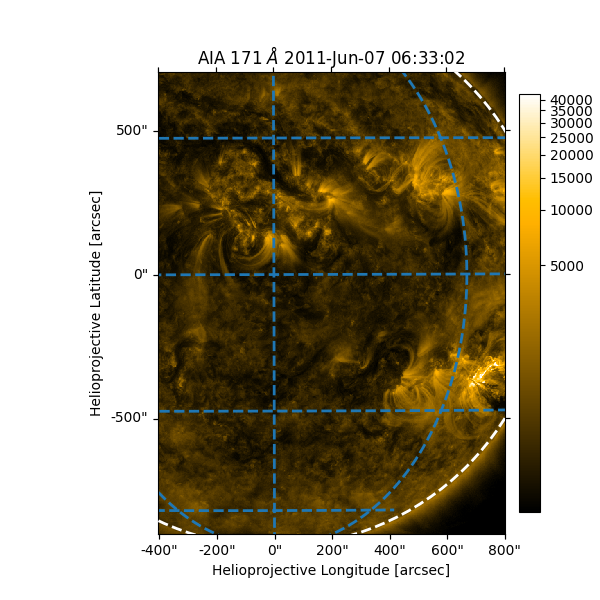
Fine grained Plotting Features of Map
How to control various plotting features of map.
import matplotlib.pyplot as plt
import astropy.units as u
from astropy.coordinates import SkyCoord
import sunpy.map
from sunpy.data.sample import AIA_171_IMAGE
SkyCoord module provides flexible celestial coordinate representation and a draw_limb method draws an edge as seen against the dark sky background. Date of the image taken can also be displayed in the plot.
aiamap = sunpy.map.Map(AIA_171_IMAGE)
bottom_left = SkyCoord(-400*u.arcsec, -900*u.arcsec, frame=aiamap.coordinate_frame)
top_right = SkyCoord(800*u.arcsec, 700*u.arcsec, frame=aiamap.coordinate_frame)
aiamap_sub = aiamap.submap(bottom_left, top_right=top_right)
title_obsdate = aiamap_sub.date.strftime('%Y-%b-%d %H:%M:%S')
The sunpy map peek method shows a helioprojective grid by default. This is sometimes not desired, and instead a heliographic Stonyhurst grid might be required. Although maps offer a simple way to include a Stonyhurst grid, often times we want more control over the Stonyhurst type. The example below illustrates some aspects of how a map plot can be altered as desired. For more information regarding the axis and grid settings, go to Ticks, tick labels and grid lines in astropy.
fig = plt.figure(figsize=(6, 6))
ax = fig.add_subplot(projection=aiamap_sub)
aiamap_sub.plot(axes=ax, clip_interval=(1, 99.99)*u.percent)
aiamap_sub.draw_limb(axes=ax, color='white', linewidth=2, linestyle='dashed')
# To have more control over the Heliographic Stonyhurst grid,
# the axes object properties can be changed directly
overlay = ax.get_coords_overlay('heliographic_stonyhurst')
lon = overlay[0]
lat = overlay[1]
lon.set_ticks_visible(False)
lat.set_ticks_visible(False)
lat.set_ticklabel_visible(False)
lon.set_ticklabel_visible(False)
lon.coord_wrap = 180
lon.set_major_formatter('dd')
# Plot the Heliographic Stonyhurst grid
overlay.grid(color='tab:blue', linewidth=2, linestyle='dashed')
# Switch off the helioprojective grid
ax.grid(False)
# Change how the helioprojective grid tick labels are formatted
tx, ty = ax.coords
# Use integer coordinates for either axis.
tx.set_major_formatter('s')
ty.set_major_formatter('s')
ax.set_title(fr'AIA 171 $\AA$ {title_obsdate}')
ax.set_ylabel('Helioprojective Latitude [arcsec]')
ax.set_xlabel('Helioprojective Longitude [arcsec]')
plt.colorbar(fraction=0.045, pad=0.03, label='DN', ax=ax)
plt.show()
Traceback (most recent call last):
File "/home/docs/checkouts/readthedocs.org/user_builds/sunpy/conda/stable/lib/python3.10/site-packages/sphinx_gallery/scrapers.py", line 340, in save_figures
rst = scraper(block, block_vars, gallery_conf)
File "/home/docs/checkouts/readthedocs.org/user_builds/sunpy/conda/stable/lib/python3.10/site-packages/sphinx_gallery/scrapers.py", line 173, in matplotlib_scraper
fig.savefig(image_path, **these_kwargs)
File "/home/docs/checkouts/readthedocs.org/user_builds/sunpy/conda/stable/lib/python3.10/site-packages/matplotlib/figure.py", line 3343, in savefig
self.canvas.print_figure(fname, **kwargs)
File "/home/docs/checkouts/readthedocs.org/user_builds/sunpy/conda/stable/lib/python3.10/site-packages/matplotlib/backend_bases.py", line 2366, in print_figure
result = print_method(
File "/home/docs/checkouts/readthedocs.org/user_builds/sunpy/conda/stable/lib/python3.10/site-packages/matplotlib/backend_bases.py", line 2232, in <lambda>
print_method = functools.wraps(meth)(lambda *args, **kwargs: meth(
File "/home/docs/checkouts/readthedocs.org/user_builds/sunpy/conda/stable/lib/python3.10/site-packages/matplotlib/backends/backend_agg.py", line 509, in print_png
self._print_pil(filename_or_obj, "png", pil_kwargs, metadata)
File "/home/docs/checkouts/readthedocs.org/user_builds/sunpy/conda/stable/lib/python3.10/site-packages/matplotlib/backends/backend_agg.py", line 457, in _print_pil
FigureCanvasAgg.draw(self)
File "/home/docs/checkouts/readthedocs.org/user_builds/sunpy/conda/stable/lib/python3.10/site-packages/matplotlib/backends/backend_agg.py", line 400, in draw
self.figure.draw(self.renderer)
File "/home/docs/checkouts/readthedocs.org/user_builds/sunpy/conda/stable/lib/python3.10/site-packages/matplotlib/artist.py", line 95, in draw_wrapper
result = draw(artist, renderer, *args, **kwargs)
File "/home/docs/checkouts/readthedocs.org/user_builds/sunpy/conda/stable/lib/python3.10/site-packages/matplotlib/artist.py", line 72, in draw_wrapper
return draw(artist, renderer)
File "/home/docs/checkouts/readthedocs.org/user_builds/sunpy/conda/stable/lib/python3.10/site-packages/matplotlib/figure.py", line 3140, in draw
mimage._draw_list_compositing_images(
File "/home/docs/checkouts/readthedocs.org/user_builds/sunpy/conda/stable/lib/python3.10/site-packages/matplotlib/image.py", line 131, in _draw_list_compositing_images
a.draw(renderer)
File "/home/docs/checkouts/readthedocs.org/user_builds/sunpy/conda/stable/lib/python3.10/site-packages/matplotlib/artist.py", line 39, in draw_wrapper
return draw(artist, renderer, *args, **kwargs)
File "/home/docs/checkouts/readthedocs.org/user_builds/sunpy/conda/stable/lib/python3.10/site-packages/astropy/visualization/wcsaxes/core.py", line 536, in draw
super().draw(renderer, **kwargs)
File "/home/docs/checkouts/readthedocs.org/user_builds/sunpy/conda/stable/lib/python3.10/site-packages/matplotlib/artist.py", line 72, in draw_wrapper
return draw(artist, renderer)
File "/home/docs/checkouts/readthedocs.org/user_builds/sunpy/conda/stable/lib/python3.10/site-packages/matplotlib/axes/_base.py", line 3064, in draw
mimage._draw_list_compositing_images(
File "/home/docs/checkouts/readthedocs.org/user_builds/sunpy/conda/stable/lib/python3.10/site-packages/matplotlib/image.py", line 131, in _draw_list_compositing_images
a.draw(renderer)
File "/home/docs/checkouts/readthedocs.org/user_builds/sunpy/conda/stable/lib/python3.10/site-packages/matplotlib/artist.py", line 39, in draw_wrapper
return draw(artist, renderer, *args, **kwargs)
File "/home/docs/checkouts/readthedocs.org/user_builds/sunpy/conda/stable/lib/python3.10/site-packages/astropy/visualization/wcsaxes/core.py", line 45, in draw
self.axes.draw_wcsaxes(renderer)
File "/home/docs/checkouts/readthedocs.org/user_builds/sunpy/conda/stable/lib/python3.10/site-packages/astropy/visualization/wcsaxes/core.py", line 481, in draw_wcsaxes
coord._draw_grid(renderer)
File "/home/docs/checkouts/readthedocs.org/user_builds/sunpy/conda/stable/lib/python3.10/site-packages/astropy/visualization/wcsaxes/coordinate_helpers.py", line 602, in _draw_grid
self._update_ticks()
File "/home/docs/checkouts/readthedocs.org/user_builds/sunpy/conda/stable/lib/python3.10/site-packages/astropy/visualization/wcsaxes/coordinate_helpers.py", line 773, in _update_ticks
w1 = wrap_angle_at(w1, self.coord_wrap.to_value(u.deg))
AttributeError: 'int' object has no attribute 'to_value'
Total running time of the script: ( 0 minutes 0.706 seconds)