Note
Go to the end to download the full example code.
Multi-scale Gaussian Normalization#
This example applies Multi-scale Gaussian Normalization to a sunpy.map.Map using sunkit_image.enhance.mgn.
import matplotlib.pyplot as plt

from astropy import units as u

import sunpy.data.sample
import sunpy.map

import sunkit_image.enhance as enhance
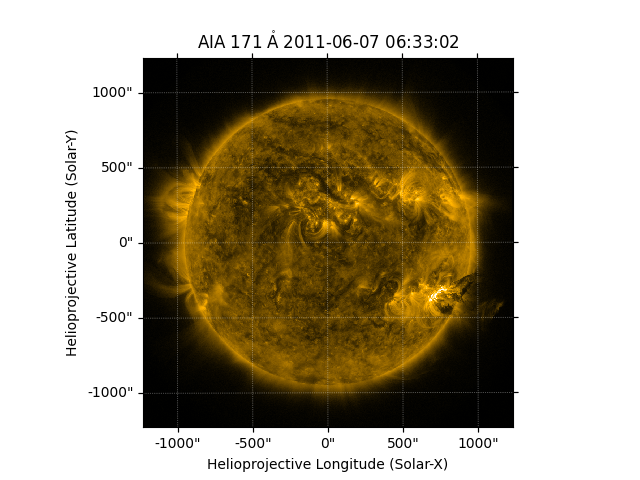
sunpy provides a range of sample data with a number of suitable images.
Here we will use a sample AIA 171 image.
aia_map = sunpy.map.Map(sunpy.data.sample.AIA_171_IMAGE)
/home/docs/checkouts/readthedocs.org/user_builds/sunkit-image/conda/latest/lib/python3.12/site-packages/astropy/io/fits/hdu/image.py:610: VerifyWarning: Invalid 'BLANK' keyword in header.  The 'BLANK' keyword is only applicable to integer data, and will be ignored in this HDU.
  warnings.warn(msg, VerifyWarning)
Applying Multi-scale Gaussian Normalization on a solar image.
The sunkit_image.enhance.mgn function takes either a sunpy.map.Map or a numpy.ndarray as a input.
mgn_map = enhance.mgn(aia_map)
Finally we will plot the filtered maps with the original to demonstrate the effect.
fig = plt.figure(figsize=(15, 10))

ax = fig.add_subplot(121, projection=aia_map)
aia_map.plot(axes=ax, clip_interval=(1, 99.99) * u.percent)

ax1 = fig.add_subplot(122, projection=mgn_map)
mgn_map.plot(axes=ax1)
ax1.set_title("MGN")

ax1.coords[1].set_ticklabel_visible(False)
fig.tight_layout()

plt.show()
Total running time of the script: (0 minutes 4.223 seconds)