Note
Go to the end to download the full example code
Radial Gradient Filters#
This example applies both the normalizing radial gradient (sunkit_image.radial.nrgf) filter and Fourier
normalizing radial gradient filter (sunkit_image.radial.fnrgf) to a sunpy map.
import astropy.units as u
import matplotlib.pyplot as plt
import sunpy.data.sample
import sunpy.map

import sunkit_image.radial as radial
from sunkit_image.utils import equally_spaced_bins
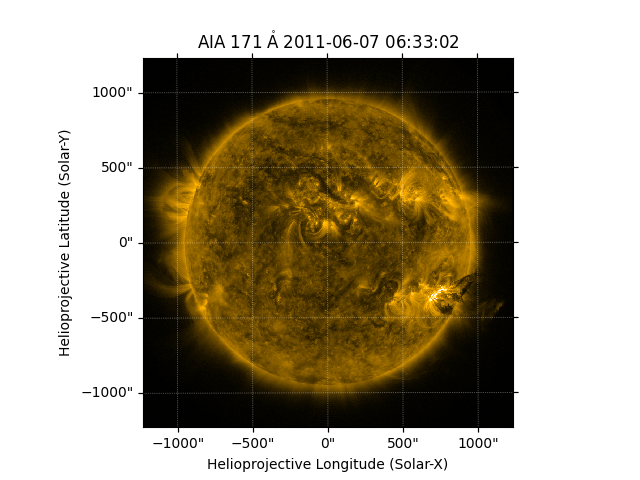
Sunpy’s sample data contain a number of suitable FITS files for this purpose.
aia_map = sunpy.map.Map(sunpy.data.sample.AIA_171_IMAGE)

# The original image is plotted to showcase the difference.
fig = plt.figure()
ax = plt.subplot(projection=aia_map)
aia_map.plot(clip_interval=(1, 99.99) * u.percent)
<matplotlib.image.AxesImage object at 0x7fdf22f93f20>
Both the NRGF and FNRGF work on radial segments above their application radius. Here we create those segments radial segments. Each segment created will be of equal dimensions radially. The distance between 1 solar radii and 2 solar radii is divided into 100 equal parts by the following two lines.
radial_bin_edges = equally_spaced_bins()
radial_bin_edges *= u.R_sun
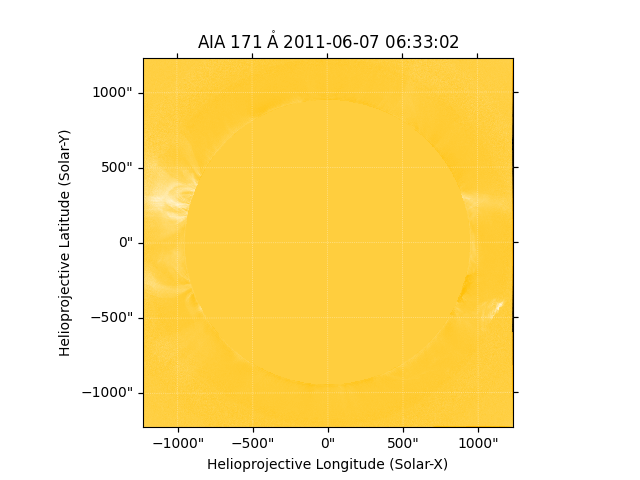
# The NRGF filter is applied after it.
out1 = radial.nrgf(aia_map, radial_bin_edges)
# The NRGF filtered map is plotted.
# The image seems a little washed out so you may need to change some plotting settings
# for a clearer output.
fig = plt.figure()
ax = plt.subplot(projection=out1)
out1.plot()
<matplotlib.image.AxesImage object at 0x7fdf229dc860>
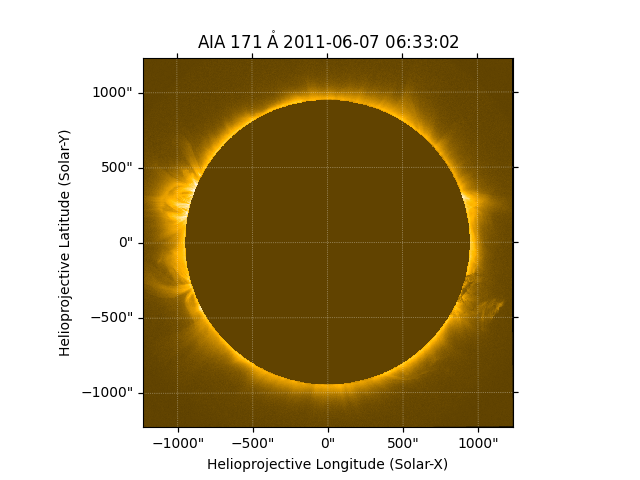
We will need to work out a few parameters for the FNRGF. Order is the number of Fourier coefficients to be used in the approximation. The attenuation coefficient are calculated to be linearly decreasing, you should choose them according to your requirements.
order = 20
attenuation_coefficients = radial.set_attenuation_coefficients(order)

# The FNRGF filter is applied after it.
out2 = radial.fnrgf(aia_map, radial_bin_edges, order, attenuation_coefficients)

# The FNRGF filtered map is plotted.
fig = plt.figure()
ax = plt.subplot(projection=out2)
out2.plot()

plt.show()
Total running time of the script: (1 minutes 12.698 seconds)