
Note
Go to the end to download the full example code.
Plotting a Level 2 SUVI Thematic Map#
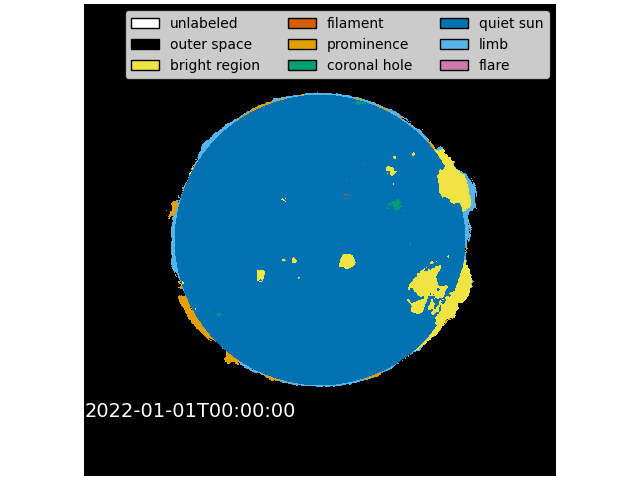
This example shows how to read a SUVI L2 Thematic Map FITS file and plot it.
SUVI L2 Thematic Maps are recognized by pattern in the filename, i.e. they contain “-l2-thmap”.
import matplotlib.pyplot as plt
from matplotlib.colors import ListedColormap
from matplotlib.patches import Patch
from parfive import Downloader

from astropy.io import fits

from sunkit_instruments.suvi._variables import SOLAR_CLASS_NAME, SOLAR_COLORS
We start with getting the data. This is done by downloading the data from data.ngdc.noaa.gov.
In this case, we will use requests as to keep this example self contained but using your browser will also work.
url = [
    "https://data.ngdc.noaa.gov/platforms/solar-space-observing-satellites/goes/goes16/l2/data/suvi-l2-thmap/2022/01/01/dr_suvi-l2-thmap_g16_s20220101T000000Z_e20220101T000400Z_v1-0-2.fits"
]
(file,) = Downloader.simple_download(url)
First let’s read a SUVI L2 Thematic Map FITS file.
with fits.open(file) as hdu:
    thmap_data = hdu[0].data
    time_stamp = hdu[0].header["DATE-OBS"][0:19]
Now we will plot it.
# Here we have some logic to get the correct color map for the SUVI L2 Thematic Map.
colortable = [
    SOLAR_COLORS[SOLAR_CLASS_NAME[i]] if i in SOLAR_CLASS_NAME else "black"
    for i in range(max(list(SOLAR_CLASS_NAME.keys())) + 1)
]
cmap = ListedColormap(colortable)

# Now the plotting code.
fig, ax = plt.subplots(constrained_layout=True)
ax.imshow(
    thmap_data,
    origin="lower",
    cmap=cmap,
    vmin=-1,
    vmax=len(colortable),
    interpolation="none",
)
ax.set_axis_off()
ax.text(0, 158, time_stamp, fontsize=14, color="white")
legend_elements = [
    Patch(facecolor=color, edgecolor="black", label=label.replace("_", " "))
    for label, color in SOLAR_COLORS.items()
]
ax.legend(
    handles=legend_elements,
    loc="upper right",
    ncol=3,
    fancybox=True,
    shadow=False,
)

plt.show()
Total running time of the script: (0 minutes 0.821 seconds)