Plotting#
Examples of visualizing supported data types
Blending maps using mplcairo
Combining off-limb and disk maps
Creating a Composite Plot with Three Maps
Creating a visualization with ArrayAnimatorWCS
Drawing a latitude-longitude quadrangle
Drawing a rectangle on a map
Drawing a rotated rectangle on a map
Drawing and using a Great Arc
Drawing heliographic longitude and latitude lines
Editing the colormap and normalization of a Map
Fading between two maps
Finding Local Peaks in Solar Data
Fine grained Plotting Features of Map
How to use the LineAnimator
Imshow and maps coordinates
Loading an HMI synoptic map
Overlay an AIA image on a LASCO C2 coronagraph
Overlaying Two Maps
Overplotting HEK feature/event polygons on a map
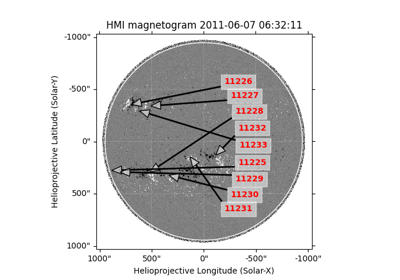
Overplotting SRS active region locations on a magnetograms
Plot positions on a blank map
Plotting a coordinate grid
Plotting a map
Plotting a solar cycle index
Plotting points on a Map with WCSAxes
Plotting the solar equator and prime meridian
Plotting the solar limb
Set Axis Range When Plotting a Map
Simple Differential Rotation
Using the sunpy Colormaps with matplotlib