Note
Go to the end to download the full example code.
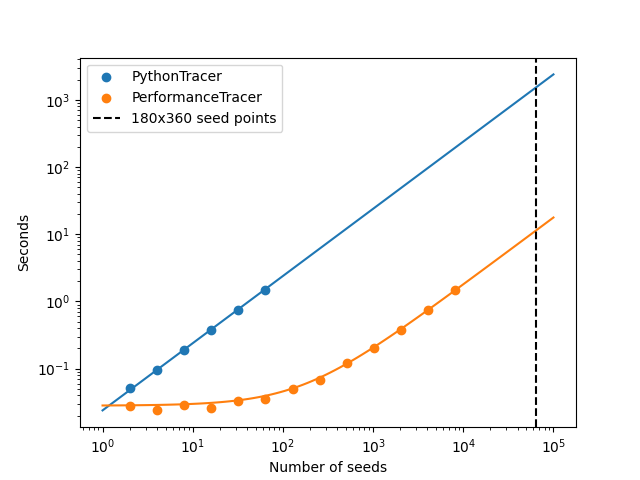
Tracer Performance#
Comparing the performance of the Python and Compiled tracers.
import timeit

import matplotlib.pyplot as plt
import numpy as np

import astropy.coordinates
import astropy.units as u

import sunpy.map

from sunkit_magex import pfss
Create a dipole map.
def dipole_Br(r, theta):
    return 2 * np.sin(theta) / r**3


ntheta = 180
nphi = 360
nr = 50
rss = 2.5
phi = np.linspace(0, 2 * np.pi, nphi)
theta = np.linspace(-np.pi / 2, np.pi / 2, ntheta)
theta, phi = np.meshgrid(theta, phi)
br = dipole_Br(1, theta)
br = sunpy.map.Map(br.T, pfss.utils.carr_cea_wcs_header('2010-01-01', br.shape))
pfss_input = pfss.Input(br, nr, rss)
pfss_output = pfss.pfss(pfss_input)
Trace some field lines.
seed0 = np.atleast_2d(np.array([1, 1, 0]))
tracers = [
    pfss.tracing.PythonTracer(),
    pfss.tracing.PerformanceTracer(),
]
nseeds = 2**np.arange(14)
times = [[] for _ in tracers]

for nseed in nseeds:
    seeds = np.repeat(seed0, nseed, axis=0)
    r, lat, lon = pfss.coords.cart2sph(seeds[:, 0], seeds[:, 1], seeds[:, 2])
    r = r * astropy.constants.R_sun
    lat = (lat - np.pi / 2) * u.rad
    lon = lon * u.rad
    seeds = astropy.coordinates.SkyCoord(lon, lat, r, frame=pfss_output.coordinate_frame)
    for i, tracer in enumerate(tracers):
        # Skip the Python tracer for large numbers of seeds.
        # It is too slow.
        if nseed > 64 and i == 0:
            continue
        t = timeit.timeit(lambda: tracer.trace(seeds, pfss_output), number=1)
        times[i].append(t)
Plot the results.
fig, ax = plt.subplots()

for i, tracer in enumerate(tracers):
    if i == 0:
        ax.scatter(nseeds[1:len(times[i])], times[i][1:], label=tracer.__class__.__name__)
        pydt = (times[0][4] - times[0][3]) / (nseeds[4] - nseeds[3])
        ax.plot([1, 1e5], [pydt, 1e5 * pydt])
    else:
        ax.scatter(nseeds[1:], times[i][1:], label=tracer.__class__.__name__)
        t0 = times[i][1]
        dt = (times[i][-1] - times[i][-2]) / (nseeds[-1] - nseeds[-2])
        ax.plot(np.logspace(0, 5, 100), t0 + dt * np.logspace(0, 5, 100))

ax.set_xscale('log')
ax.set_yscale('log')
ax.set_xlabel('Number of seeds')
ax.set_ylabel('Seconds')
ax.axvline(180 * 360, color='k', linestyle='--', label='180x360 seed points')
ax.legend()

plt.show()
Total running time of the script: (0 minutes 7.373 seconds)