Note
Go to the end to download the full example code.
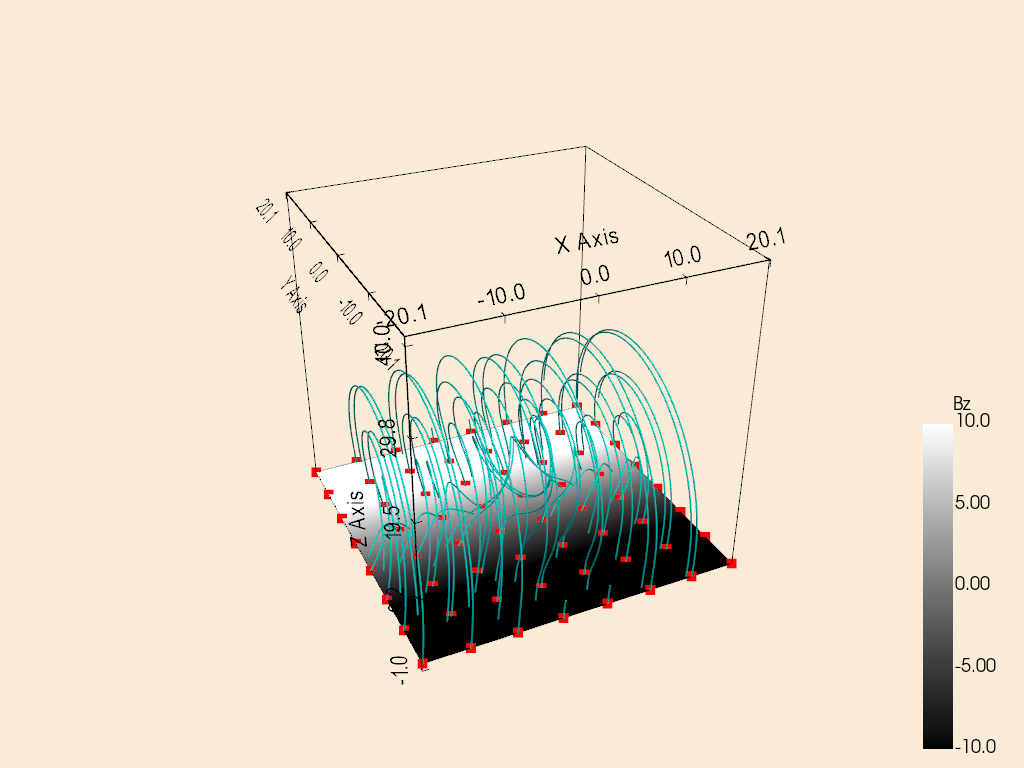
Plotting field lines in a Cartesian box#
This example uses an analytical magnetic field for a magnetic flux rope in the solar corona from Hesse et al. (2005) to demonstrate how to plot field lines in a Cartesian box.
Note
This example requires the streamtracer package to be installed.
import numpy as np

from sunkit_pyvista import CartesianPlotter
We begin with the magnetic flux rope model from Hesse et al. (2005). The implementation is taken from the flhtools package, which is accompanied by the paper by Yeates and Page (2018).
We create a 3D grid and compute the magnetic field components on the grid.
def calculate_bx(x, y, z):
    return x * 0 - 2


def calculate_by(x, y, z, t=2):
    return -z - t * (1 - z**2) / (1 + z**2 / 25) ** 2 / (1 + x**2 / 25)


def calculate_bz(x, y, z):
    return y


nx, ny, nz = 64, 64, 64
x1 = np.linspace(-20, 20, nx)
y1 = np.linspace(-20, 20, ny)
z1 = np.linspace(0, 40, nz)
x, y, z = np.meshgrid(x1, y1, z1, indexing="ij")

bx, by, bz = calculate_bx(x, y, z), calculate_by(x, y, z), calculate_bz(x, y, z)
b_total = np.stack([bx, by, bz], axis=-1)
We now define the seed points required to trace the magnetic field lines.
Finally, we CartesianPlotter to plot the field lines
in a Cartesian box.
plotter = CartesianPlotter()
plotter.set_background("antiquewhite")

# Define the vector field using the magnetic field data and the grid coordinates.
plotter.define_vector_field(b_total, grid_coords=(x1, y1, z1))

# Show the axes of the box
plotter.show_bounds()

# Show the outline of the box
plotter.show_outline(color="black")

# Show Bz component (0 is x, 1 is y, 2 is z) on the bottom boundary of the box with a gray colormap.
plotter.show_boundary(
    "bottom",
    component=2,
    cmap="gray",
    clim=[-10, 10],
    show_scalar_bar=True,
    scalar_bar_args=dict(
        title="Bz",
        vertical=True,
    ),
)

# Plot field lines from the defined seeds.
plotter.plot_field_lines(
    seeds, color="cyan", radius=0.1, seeds_config=dict(show_seeds=True, color="red", point_size=10)
)

# Set the camera position for a better view
plotter.camera.azimuth = 200
plotter.camera.elevation = -5
plotter.camera.zoom(0.8)

plotter.show()
/home/docs/checkouts/readthedocs.org/user_builds/sunkit-pyvista/conda/latest/lib/python3.12/site-packages/sunkit_pyvista/plotter.py:733: PyVistaFutureWarning: The default value of `algorithm` for the filter
`StructuredGrid.extract_surface` will change in the future. It currently defaults to
`'dataset_surface'`, but will change to `None`. Explicitly set the `algorithm` keyword to
silence this warning.
  surface = self._mesh.extract_subset(subset).extract_surface()
Total running time of the script: (0 minutes 2.686 seconds)