Note
Go to the end to download the full example code.
Calculate the GOES-XRS temperature and emission measure during a flare#
This example shows you how to estimate the GOES-XRS isothermal temperature and emission measure during a solar flare. This is done using the observed flux ratio of the short (0.5-4 angstrom) to long (1-8 angstrom) channels, based on the methods described in White et al. (2005). The functionality available here is the same as the functionality available in SSWIDL.
import matplotlib.pyplot as plt

from sunpy import timeseries as ts
from sunpy.data.sample import GOES_XRS_TIMESERIES

from sunkit_instruments import goes_xrs
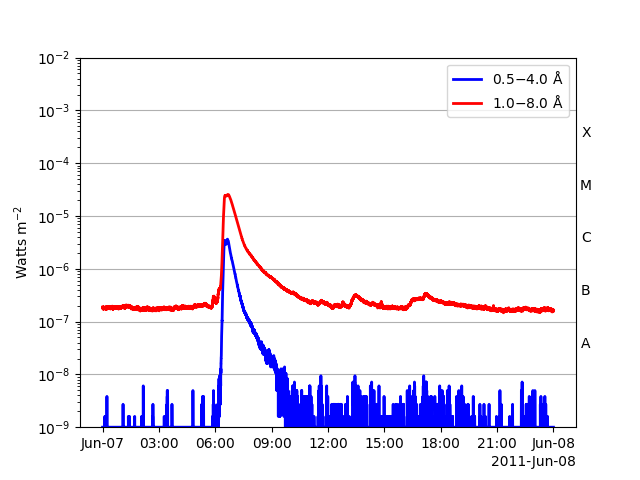
Let’s begin by creating a GOES-XRS timeseries. We can use the sample data here to load in an example of a flare.
<Axes: ylabel='Watts m$^{-2}$'>
The estimation is only valid for large fluxes (i.e. during a flare), so let’s truncate the timeseries over the time of the flare.
goes_flare = goes_ts.truncate("2011-06-07 06:15", "2011-06-07 09:00")
Now let’s calculate the temperature and emission measure estimates from
these channel fluxes. We can do this by using the function
sunkit_instruments.goes_xrs.calculate_temperature_em which
takes a sunpy.timeseries.sources.XRSTimeSeries and returns a new timeseries
which contains both the respective temperature and emission measure values.
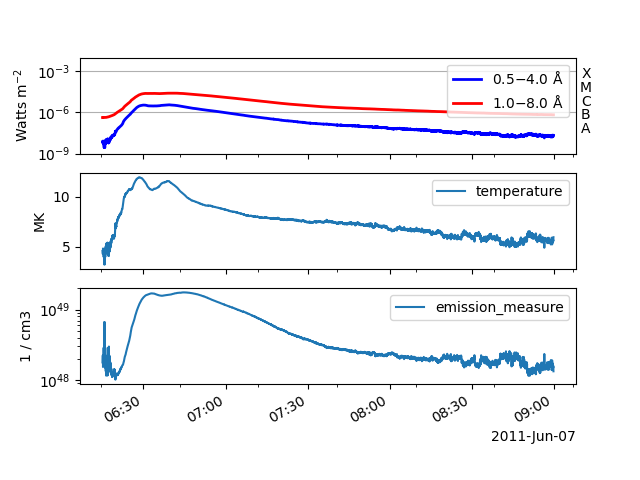
goes_temp_em = goes_xrs.calculate_temperature_em(goes_flare)
We can see that goes_temp_em is now a timeseries that contains the temperature and emission measure by printing out the column names.
print(goes_temp_em.columns)
['temperature', 'emission_measure']
Now let’s plot these all together.
fig, (ax1, ax2, ax3) = plt.subplots(3, sharex=True)
goes_flare.plot(axes=ax1)
goes_temp_em.plot(columns=["temperature"], axes=ax2)
goes_temp_em.plot(columns=["emission_measure"], axes=ax3)
ax3.set_yscale("log")
plt.show()
Total running time of the script: (0 minutes 1.290 seconds)